 MetaTrader 5
 Experts
 Indicators
 Scripts
 Libraries
 Storage
Watch how to download trading robots for free
Find us on Twitter!
Join our fan page
Join our fan page
You liked the script? Try it in the MetaTrader 5 terminal

Trend Filtered Donchian Breakout Channel - indicator for MetaTrader 5
Kenichiro Sakamoto

I'm Kenichiro Sakamoto, the developer behind FXEA365 — a studio building transparent, rule-based Expert Advisors for MetaTrader 5.
- Views:
- 60
- Published:
-
 You are missing trading opportunities:
- Free trading apps
- Over 8,000 signals for copying
- Economic news for exploring financial markets
Registration Log inYou agree to website policy and terms of use
If you do not have an account, please register -
 Need a robot or indicator based on this code? Order it on Freelance
Go to Freelance

The indicator plots a Donchian channel together with a long-period simple moving average and marks channel breakouts that agree with the moving average. The channel on each bar is the highest high and the lowest low of EntryChannel bars that end two bars back, so the bar that is tested for a breakout is not part of its own channel.
An upward breakout is marked when the previous bar closed above the upper channel line and above the SMA. A downward breakout is marked when the previous bar closed below the lower channel line and below the SMA. Breakouts against the SMA are ignored. With LongOnly enabled, only upward breakouts are marked.
The arrow is drawn on the bar that follows the breakout bar, 0.1 percent below its low for an upward breakout and 0.1 percent above its high for a downward one. The same arrow symbol is used for both directions, so the direction is read from its position relative to the bar. The conditions use closed bars only. The indicator works on any symbol and timeframe and needs at least EntryChannel + TrendSMA + 2 bars of history.
Input parameters
- EntryChannel - Donchian channel length in bars (default 20).
- TrendSMA - period of the trend filter SMA (default 200).
- LongOnly - mark upward breakouts only (default false).
Buffers: 0 - upper channel, 1 - lower channel, 2 - trend SMA, 3 - breakout arrows (0 where there is no arrow). The indicator does not place or manage trades.
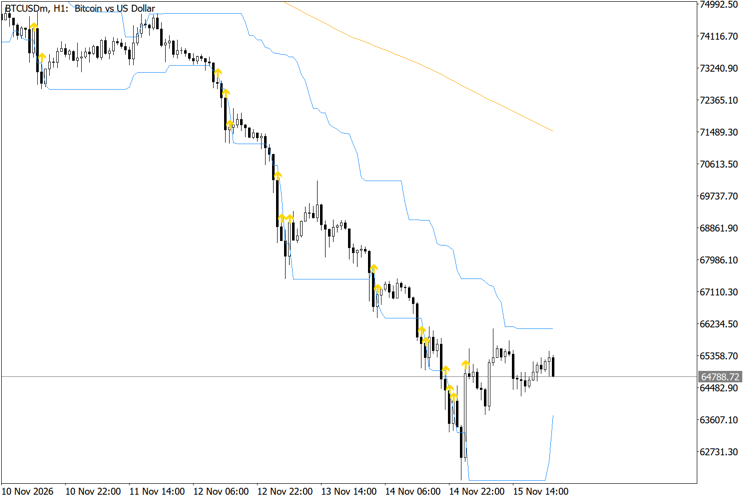
Donchian channel, trend SMA and filtered breakout arrows on BTCUSD H1
RSI Pullback Zones Above Rising SMA
Plots a long-period SMA and marks bars where the RSI has pulled back to a set level while the price is still above the rising SMA.
Bollinger Keltner Squeeze Release Arrows
Shows Bollinger bands and a Keltner channel on the chart, marks bars where the bands are inside the channel and draws an arrow when that squeeze ends.
Accelerator Oscillator (AC)
The Acceleration/Deceleration Indicator (AC) measures acceleration and deceleration of the current driving force.
MACD Signals
Indicator edition for new platform.