 MetaTrader 5
 Experts
 Indicators
 Scripts
 Libraries
 Storage
Watch how to download trading robots for free
Find us on Facebook!
Join our fan page
Join our fan page
You liked the script? Try it in the MetaTrader 5 terminal

Premium and Discount Zones Based on the Current Swing Range - indicator for MetaTrader 5

- Views:
- 26
- Published:
-
 You are missing trading opportunities:
- Free trading apps
- Over 8,000 signals for copying
- Economic news for exploring financial markets
Registration Log inYou agree to website policy and terms of use
If you do not have an account, please register -
 Need a robot or indicator based on this code? Order it on Freelance
Go to Freelance

Premium and Discount Zones Based on the Current Swing Range
The idea behind it
Many price-action traders divide a price range into two halves. The upper half is called Premium: prices there are expensive relative to the range, so traders look for sells or take profit on longs. The lower half is called Discount: prices there are cheap relative to the range, so traders look for buys or take profit on shorts. The middle line, at 50%, is called Equilibrium.
The indicator builds this map automatically:
- Swing highs and swing lows are detected with fractals: a swing high has a higher High than InpSwingBars bars on each side, and a swing low has a lower Low. A swing is confirmed only when those following bars are closed.
- The current range is defined by the last confirmed swing high and the last confirmed swing low. It starts at the older of the two swings.
- The range High and Low are the extremes since that start, so the range widens automatically if price breaks out of it before a new swing is confirmed.
- The range is split at 50% into the Premium and the Discount zones.
The indicator keeps its state between calls. At start it scans a limited number of bars; after that every new closed bar is processed once. The range extremes are re-measured only when a new swing is confirmed, and on every tick the objects are redrawn only if the range actually changed.
How to interpret it
- Premium zone (gray dashed box, upper half) - prices above the 50% level of the range.
- Discount zone (white dashed box, lower half) - prices below the 50% level of the range.
- Equilibrium line (dotted line) - the middle of the range. The label shows its price.
- Zone labels - "Premium" and "Discount" at the left edge of each box.
- Info label (top-left corner) - the zone of the current Bid price and its position in the range as a percentage: 0% is the range Low and 100% is the range High, for example Price in Premium: 61% of range.
- Typical reading - in an up-trend, pull-backs into the Discount zone are watched for buys; in a down-trend, rallies into the Premium zone are watched for sells. A price that stays far from equilibrium shows how stretched the move is.
- The boxes start at the older swing and extend to the right, so you can see how long the current range has been valid.
External variables (inputs)
| Input | Default | Purpose |
|---|---|---|
| Swing range | ||
| InpSwingBars | 5 | Number of bars on each side of a swing (1 to 30). Larger values give a wider, more significant range |
| InpLookbackBars | 500 | Number of bars scanned when the indicator starts (30 to 5000) |
| Zones | ||
| InpShowPremium | true | Show the Premium zone (upper half) |
| InpShowDiscount | true | Show the Discount zone (lower half) |
| InpShowEquilibrium | true | Show the Equilibrium line (50%) |
| InpExtendBars | 20 | Number of bars the zones extend to the right of the last bar (0 to 200) |
| Appearance | ||
| InpPremiumColor | clrGray | Color of the Premium zone |
| InpDiscountColor | clrWhite | Color of the Discount zone |
| InpEqColor | clrSilver | Color of the Equilibrium line |
| InpZoneStyle | STYLE_DASH | Border style of the zones |
| InpEqStyle | STYLE_DOT | Style of the Equilibrium line |
| InpLineWidth | 1 | Border and line width (1 to 5). Dash and dot styles are drawn only with width 1 |
| InpFillZones | false | Fill the zones with color |
| InpShowLabels | true | Show the zone labels at the left edge |
| InpLabelSize | 8 | Font size of the zone labels (6 to 20) |
| Info label | ||
| InpShowInfo | true | Show the label with the position of the price in the range |
| InpInfoColor | clrWhite | Color of the info label |
Recommended use
- Works on any symbol and timeframe. Use a small InpSwingBars for a short-term range (intraday charts) and a large one for the major range (H4 and above).
- The swing range changes when a new swing is confirmed, which happens InpSwingBars bars after the swing forms. The zones can therefore shift after a new swing appears; closed bars, once drawn, are not recalculated differently on later ticks.
- The Premium and Discount zones describe where the price is inside a range, not the direction of the market. Combine them with the trend, higher-timeframe levels and your own entry rules.
- When price breaks far outside the range, the range widens with the new extreme until new swings are confirmed. In strong trends the range can therefore be very large.
- On the first start only the last InpLookbackBars bars are scanned, and a range is shown only after both a swing high and a swing low have been confirmed in that history.
- Prices are taken from the current Bid, or from the last close if there is no quote yet.
- All objects use the prefix PdZones_ and are removed when the indicator is deleted from the chart. Do not attach two copies to the same chart because they would share object names.
- It is a chart indicator only and does not trade, so it works the same on netting and hedging accounts.
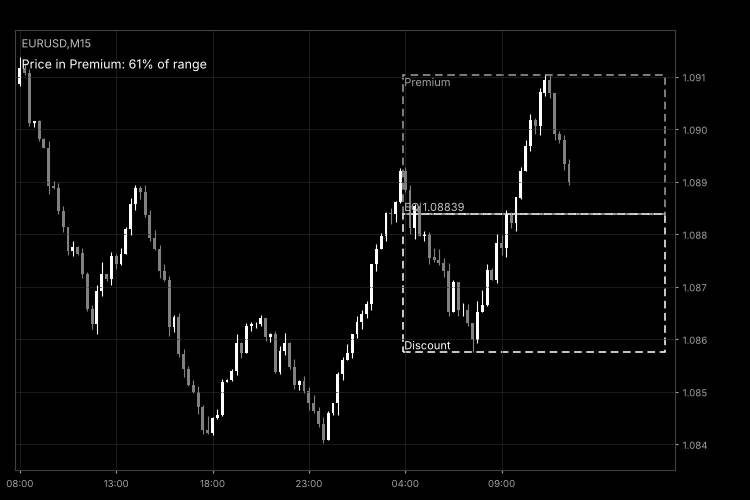
Fig. 1. PremiumDiscountZones on an M15 chart with default settings: Premium (gray), Discount (white) and the Equilibrium line (black and white image per Code Base guidelines).
Break of Structure (BOS) and Change of Character (CHoCH) Labels
Detects swing highs and lows and labels every break of market structure: BOS (Break of Structure) when the trend continues and CHoCH (Change of Character) when the trend reverses.
Fair Value Gap (FVG) Detector with Auto-Removal When Filled
Detects bullish and bearish Fair Value Gaps (three-candle price imbalances), draws them as boxes extending to the right and automatically removes each box once the price fills the gap.
Accelerator Oscillator (AC)
The Acceleration/Deceleration Indicator (AC) measures acceleration and deceleration of the current driving force.
MACD Signals
Indicator edition for new platform.