 MetaTrader 5
 Experts
 Indicators
 Scripts
 Libraries
 Storage
Watch how to download trading robots for free
Find us on Twitter!
Join our fan page
Join our fan page
You liked the script? Try it in the MetaTrader 5 terminal

- Views:
- 72
- Published:
-
 You are missing trading opportunities:
- Free trading apps
- Over 8,000 signals for copying
- Economic news for exploring financial markets
Registration Log inYou agree to website policy and terms of use
If you do not have an account, please register -
 Need a robot or indicator based on this code? Order it on Freelance
Go to Freelance

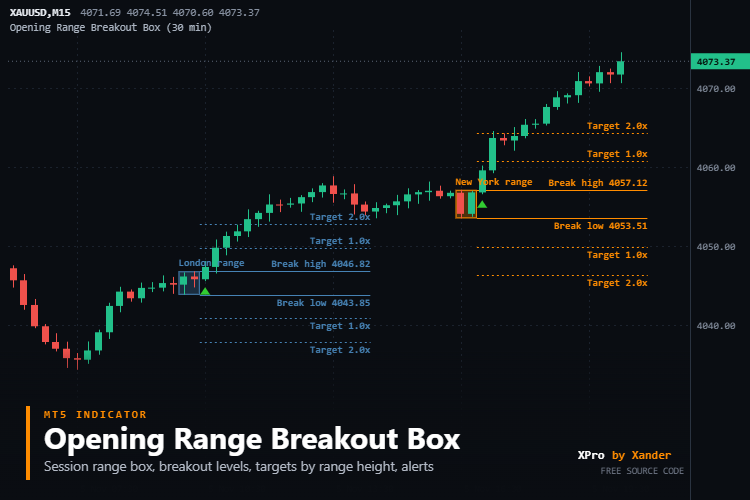
The first minutes of a session on Gold (XAUUSD) leave a high and a low that breakout traders watch for hours. This indicator takes the candles that open inside that window, 30 minutes by default, draws a box from the highest high to the lowest low and projects both edges forward as breakout levels. Up to three sessions run on the same chart, each with its own name, start time and colour.
Above and below the box it draws two target lines, at 1.0 and 2.0 times the range height. A breakout counts only when a candle closes beyond a level, never on the forming candle, and once per side in each session. That candle gets an arrow and, if turned on, a popup, push or sound alert.
Start times are broker server time, so set them for your broker. The defaults, 10:00 and 16:30, match the London and New York stock opens on a GMT+2 server. A close outside the range can fail and come back inside, so the entry, the stop and the size stay your decision.
Settings
- Range length: minutes of the opening window. Default 30.
- Levels stay active after the range: minutes the breakout and target lines run after the window closes, and the time in which a breakout is checked. Default 240.
- Days of history to draw: default 10. Objects of older ranges are removed as new sessions start.
- Session 1, 2 and 3: on or off, name, start as HH:MM in server time and colour. Defaults: London 10:00 on, New York 16:30 on, Asia 02:00 off.
- Breakout buffer: extra distance beyond the range high and low, in points. Default 0. The breakout lines and the close check both use it.
- Show target lines, Target 1 and Target 2: multiples of the range height, measured from the range high upward and from the range low downward. Defaults 1.0 and 2.0. A value of 0 hides that target.
- Fill the range box and Show text labels: both on by default.
- Arrow on the candle that closes outside the range (on), popup alert (on), push notification and sound (off), plus the sound file name. The message carries the symbol, the timeframe, the session name, the direction, the time and close of the candle and the range low and high.
What it needs
Any symbol. The chart timeframe has to be equal to or lower than the range length, for example M1, M5, M15 or M30 with a 30 minute range. On a higher timeframe it writes a message in the log and draws nothing. The range is built from candles that open inside the window, so use a timeframe that fits the start time and the length. It draws with standard chart objects (rectangle, trend line, text) and two arrow buffers, and it never trades. Push notifications need your MetaQuotes ID in the terminal options. Wrong inputs or a start time that is not HH:MM stop the indicator with a message in the log. When history is loaded only the arrows are drawn, alerts are sent for candles that close while the indicator is running.
Make it yours
Run it on XAUUSD, XAGUSD, EURUSD, GBPUSD, US30 or NAS100 and compare a 15, 30 and 60 minute range on M5 and M15. From an EA you can read it with iCustom: buffer 0 is the high and buffer 1 the low of the active range (the most recent one when two overlap), buffer 2 holds the breakout up arrow and buffer 3 the breakout down arrow. The session start is worked out in one place inside OnCalculate, and XP_DrawBox, XP_DrawLevels and XP_Notify are small functions you can lift into your own code. It is a good base to add a session or news filter, a higher timeframe trend check, Smart Money Concepts levels or support and resistance before you take the breakout.
About this code
Open source. Use it as it is, adapt it, build your own version on top of it.
New versions and new tools are announced first on my MQL5 channel: https://www.mql5.com/en/channels/xander
Questions, suggestions and your own backtests are welcome in the Xander Lab group: https://www.mql5.com/en/messages/02eec85e4364dd01
More tools on my profile: https://www.mql5.com/en/users/09151993a
Provided as is, use at your own risk.
Related
- Supertrend Gold Signals
- Forex Session Boxes
- Fair Value Gap Zones Tracker
- Liquidity Sweep Equal Highs Lows
Changelog
- v1.0 - 2026-11-12 - Initial release
 Spread Session Recorder
Records the spread of one or many symbols to CSV every minute (min, time-weighted average, max), with ready tables per hour of day and per trading session. Restart-safe, never trades.
 Multi-Session Range Boxes with Spread, StopsLevel and ATR HUD
Draws non-repainting Tokyo/Asia, London, and New York intraday session high/low range boxes, exposes running session High/Low buffers for EAs via iCustom, and displays a live Spread, Broker StopsLevel, and ATR(14) points HUD.
Accelerator Oscillator (AC)
The Acceleration/Deceleration Indicator (AC) measures acceleration and deceleration of the current driving force.
MACD Signals
Indicator edition for new platform.