 MetaTrader 5
 Experts
 Indicators
 Scripts
 Libraries
 Storage
Watch how to download trading robots for free
Find us on Twitter!
Join our fan page
Join our fan page
You liked the script? Try it in the MetaTrader 5 terminal

Previous Day and Week High Low Levels - indicator for MetaTrader 5
Dragos Mihai Ofrim

DuoFX Labs: trading tools for MetaTrader 5 and MetaTrader 4
We build the tools we use ourselves: fast, clean and honest about what they do. Every product ships for both MT5 and MT4 from the same code, is tested on live charts before release, and gets updates when traders ask for something.
We build the tools we use ourselves: fast, clean and honest about what they do. Every product ships for both MT5 and MT4 from the same code, is tested on live charts before release, and gets updates when traders ask for something.
- Views:
- 96
- Published:
-
 You are missing trading opportunities:
- Free trading apps
- Over 8,000 signals for copying
- Economic news for exploring financial markets
Registration Log inYou agree to website policy and terms of use
If you do not have an account, please register -
 Need a robot or indicator based on this code? Order it on Freelance
Go to Freelance
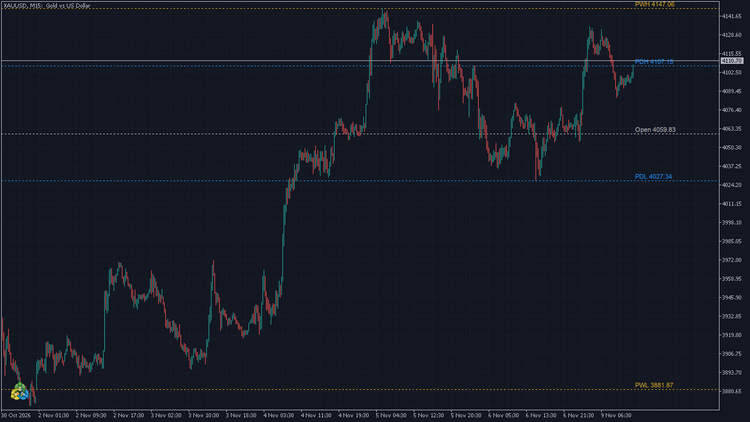
Many traders watch yesterday's and last week's extremes and the daily open as reference levels for breakouts, rejections and targets. This indicator draws them on any chart timeframe:
- PDH / PDL: previous day high and low
- PWH / PWL: previous week high and low
- Open: today's open
Each line has a small label with its name and price, kept just to the right of the last candle. The levels come from the D1 and W1 bars of the symbol, so a "day" is the broker's server day. They are recalculated when a new D1 bar opens and use only completed days and weeks, so they do not repaint during the day. If D1 or W1 history is still loading, the indicator waits for the next tick and draws then.
All lines and labels are removed when the indicator is taken off the chart.
Inputs
| Input | Default | What it does |
|---|---|---|
| Previous day high/low colour | Dodger blue | PDH and PDL colour |
| Previous week high/low colour | Goldenrod | PWH and PWL colour |
| Today's open colour | Silver | Open line colour |
| Show previous week | true | Draw PWH and PWL |
| Show today's open | true | Draw the open line |
| Line style | Dot | Style of all lines |
| Line width | 1 | Width of all lines |
| Show labels | true | Name and price next to each line |
| Label font size | 8 | Label text size |
Trading Session Boxes: Tokyo, London, New York
Draws the Tokyo, London and New York sessions of the last few days as boxes from each session's high to its low, with the high and low printed on the chart. Session hours are set in server time.
Candle Timer with Spread and Swap Countdown
Countdown to the close of the current bar, the live spread in points and the time left until the next server midnight, when brokers roll positions over and charge swap.
Ondas de wolfe
This is an indicator that identifies Wolfe waves and plots them
MACD Signals
Indicator edition for new platform.