 MetaTrader 5
 Experts
 Indicators
 Scripts
 Libraries
 Storage
Join our fan page

Opening Range Breakout with Statistics Dashboard - indicator for MetaTrader 5

- Views:
- 179
- Published:
-
 You are missing trading opportunities:
- Free trading apps
- Over 8,000 signals for copying
- Economic news for exploring financial markets
Registration Log inYou agree to website policy and terms of use
If you do not have an account, please register -
 Need a robot or indicator based on this code? Order it on Freelance
Go to Freelance
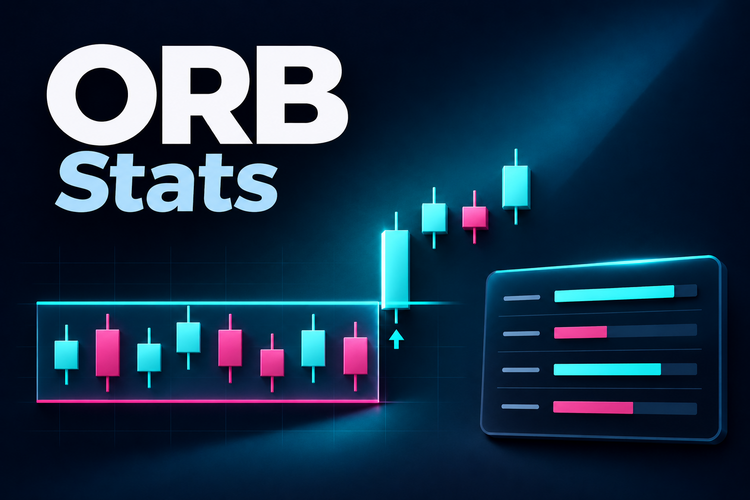
Most ORB tools draw the box and stop there. This one also shows how the range has behaved on the symbol you're looking at.
You set the range window in server time, e.g. 00:00–01:00 or your session open. Each day gets a box with its high and low lines. A breakout counts only on a candle close beyond the range, so nothing repaints.
The dashboard covers the lookback period (60 days by default):
- days counted
- share of days broken up, down, both ways, or not at all
- share of breakouts that reached the target (a multiple of the range) before touching the other side
- average range size in points
Stats are recalculated once per new day, so the load on the terminal stays low. Results can differ a lot between symbols and range windows, so it's worth trying a few.
Notes: today's range is drawn but left out of the stats until the day is complete. Only trading days with bars in history are counted, so holidays and short sessions can make 'days counted' lower than the lookback. A breakout is confirmed by a candle close, while the target is checked against bar highs and lows. If one bar hits the target and also closes beyond the opposite side, it counts as a miss, so the results lean conservative.
Range start and end must line up with the chart timeframe (08:15 won't work on M30). Ranges that cross midnight aren't supported, and timeframes from H4 up aren't either. You can run several copies on one chart with different settings.
Inputs: range start and end, lookback days, target multiple, colors.
Prop Firm Guard Panel
Prop Firm Guard Panel is an on-chart panel for prop firm challenges and funded accounts. It shows in real time the daily loss used and the room left, the max loss room and equity floor, and the progress toward the profit target. The start-of-day balance is rebuilt from today's closed deals, so the values stay correct after a restart. Colors change from green to orange to red as limits get closer, with optional popup and push alerts. Auto, dark or light theme. Display only: it never opens, modifies or closes trades.
Mouse Scroll Zoom in Zoom Out
Mouse Scroll Zoom in Zoom Out
Accelerator Oscillator (AC)
The Acceleration/Deceleration Indicator (AC) measures acceleration and deceleration of the current driving force.
MACD Signals
Indicator edition for new platform.