 MetaTrader 5
 Experts
 Indicators
 Scripts
 Libraries
 Storage
Join our fan page

Support and Resistance Channels Ranked by Strength - indicator for MetaTrader 5

- Views:
- 188
- Rating:
- Published:
- Updated:
-
 You are missing trading opportunities:
- Free trading apps
- Over 8,000 signals for copying
- Economic news for exploring financial markets
Registration Log inYou agree to website policy and terms of use
If you do not have an account, please register -
 Need a robot or indicator based on this code? Order it on Freelance
Go to Freelance
Need a robot or indicator based on this code? Order it on Freelance
Go to Freelance
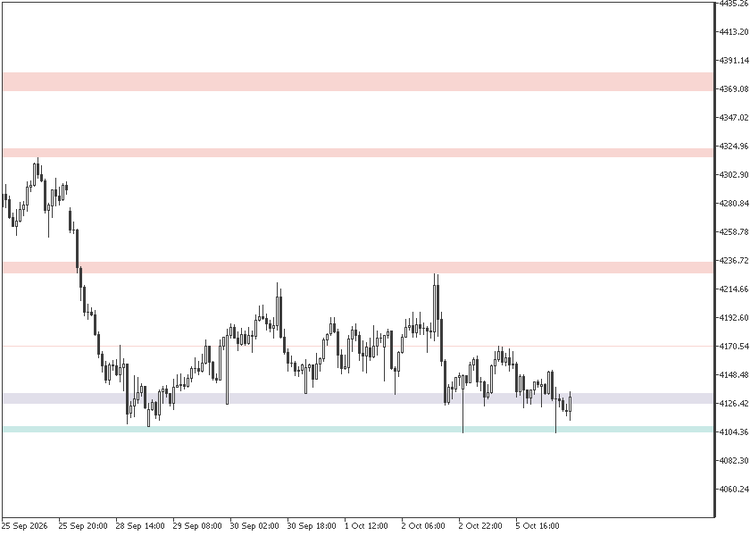
A line drawn at an old high is a guess. A price band where several tops and bottoms cluster, and where price kept coming back bar after bar, carries real weight, and this indicator measures that weight. It collects the latest pivots, groups the ones that sit close together into channels, gives each channel a score and draws the strongest ones as shaded bands across the whole chart.
The bands are colored by where price is right now. A channel entirely above the current price is resistance and turns vermilion; a channel entirely below it is support and turns teal; the channel price is trading inside turns violet gray. The color follows the live price, so a band changes role on the chart the moment price crosses it.
How a channel earns its score
With the default settings, pivots are tops and bottoms with ten bars on each side, taken on the wicks or on the candle body. A pivot stays in use for 290 bars after it is confirmed. Each one is the seed of a candidate channel, which then takes in, from the newest pivot to the oldest, every other pivot that keeps it within the width limit.
That limit is 5% of the high-low range of the last 300 bars, so the width adapts on its own: narrow on a quiet M15 chart, wider on a volatile H4. A channel scores 20 points for each pivot inside it and one more point for every bar across the lookback whose high or low landed inside it. Both kinds of evidence count: the turns that built the level and the bars that tested it.
The selection is greedy. The best score wins a place, every other candidate with an edge inside the winner is discarded, and the process repeats until up to ten channels are kept. The six strongest are drawn by default.
Levels that hold still
Channels are rebuilt only when a new pivot is confirmed. Between pivots they stay exactly where they are, so the bands do not shift with every tick. Closed bars feed a confirmed state, and the bar in progress is applied to a copy of it, so a tick on the open bar never rewrites the confirmed history. On load the indicator works through the last 5,000 closed bars, and the bands are drawn on the background, behind the candles, at a quarter of their color's strength over the chart background, which keeps them readable on light and dark themes alike. A channel built from a single pivot has no height and shows as a thin outline.
Breaks, pivot marks and averages
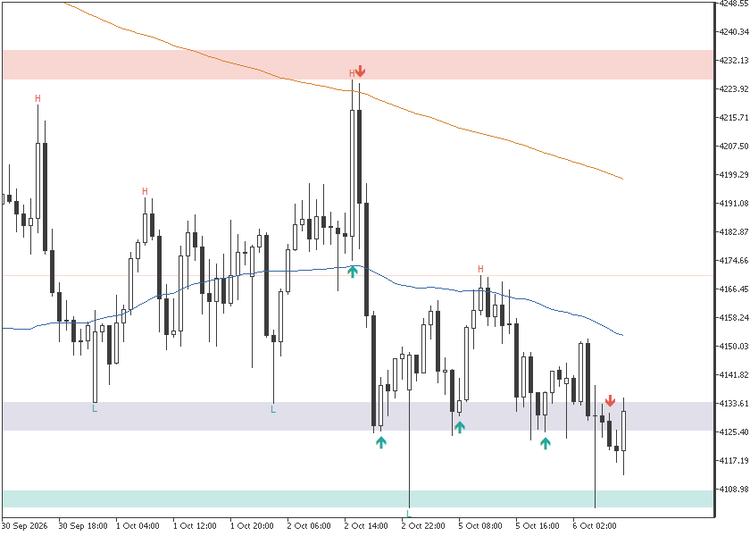
- Break arrows: an up arrow under the bar when the close moves above the top of a channel on the chart, and a down arrow over the bar when it drops below the bottom. A close that lands inside another channel shown is not a break, so price moving from one band straight into the next is left unmarked.
- Pivot marks: H above every top and L below every bottom, in the resistance and support colors. They show which turns are feeding each channel.
- Two moving averages of the close, each one off, simple or exponential, with its own period. Their colors are set in the Colors tab.
Alerts
A channel break can raise a pop-up alert, or a pop-up plus a push notification to the MetaTrader mobile app. The alert fires once per bar, when the bar closes, with the symbol, the timeframe and whether resistance or support was broken. It works whether the break arrows are on the chart or not.
Inputs
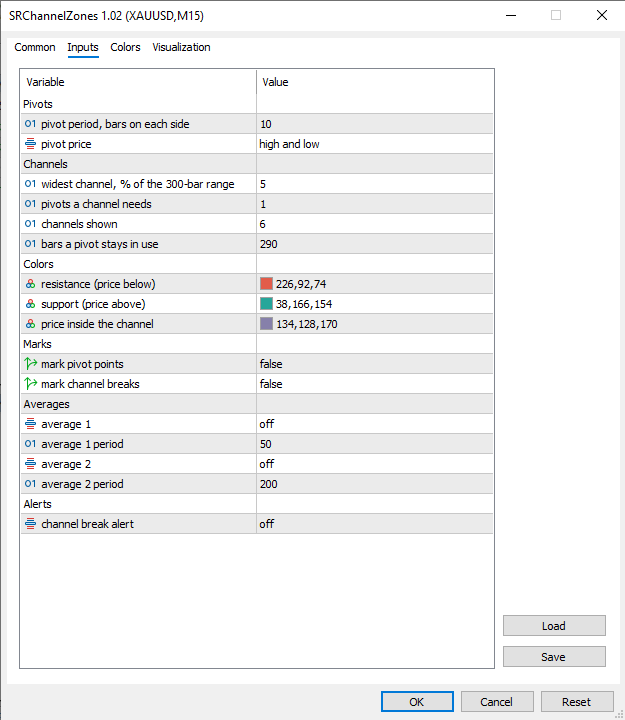
- Pivots: pivot period, the bars on each side of a top or bottom (10, from 4 to 30), and the pivot price, high and low or candle body.
- Channels: widest channel as a percentage of the 300-bar range (5, from 1 to 8), pivots a channel needs (1), channels shown (6, up to 10) and bars a pivot stays in use (290, from 100 to 400). The pivots setting is a strength floor of 20 points per pivot: at 2, only channels scoring 40 or more are drawn.
- Colors: resistance, support and price inside the channel. The arrows and pivot marks use the same colors.
- Marks: pivot marks and break arrows, both off by default.
- Averages: average 1 with its period (50) and average 2 with its period (200), each off by default, simple or exponential.
- Alerts: channel break alert, off, pop-up, or pop-up and push.
Works on any symbol and timeframe, draws with chart objects and indicator buffers only, and removing it clears everything it drew.
Educational content, not financial advice. Trading involves risk of loss.
 ExportBars - bars to CSV that pandas reads without arguments
Exports bars to a CSV file that pandas.read_csv() loads without encoding, separator or date-format arguments: ISO 8601 timestamps, prices at the symbol's own digits, single-byte encoding. Two modes (last N bars or a date range) and a switchable separator for Excel.
StopDistance - bar range in points with a suggested stop level
Shows the range of every bar in points, its moving average (SMA or EMA) and a suggested stop distance (average x factor). A stop tighter than the typical bar range gets taken out by ordinary noise; the indicator makes that threshold visible in points, the same unit a stop loss is set in.
 EMA Cross Scalper M15 (XAUUSD, WIB session filter)
EMA(10) x EMA(30) scalper for XAUUSD on the M15 timeframe with a Jakarta session filter. Educational example: fixed lot size, SL/TP in points, maximum of 1 position, spread filter. Tested on 100% real ticks.
QCL Heikin Flow MT5
QCL Heikin Flow applies two-stage smoothing to Heikin Ashi candles, helping traders filter price noise and visualize trend direction. Features adjustable smoothing periods, four moving average methods, and customizable candle colors.