 MetaTrader 5
 Experts
 Indicators
 Scripts
 Libraries
 Storage
Join our fan page

Auto ZigZag Fibonacci Golden Zone Indicator For MT5 - indicator for MetaTrader 5

- Views:
- 2170
- Rating:
- Published:
- Updated:
-
 You are missing trading opportunities:
- Free trading apps
- Over 8,000 signals for copying
- Economic news for exploring financial markets
Registration Log inYou agree to website policy and terms of use
If you do not have an account, please register -
 Need a robot or indicator based on this code? Order it on Freelance
Go to Freelance
Need a robot or indicator based on this code? Order it on Freelance
Go to Freelance
The Auto ZigZag Fibonacci Golden Zone indicator is a professional technical tool for MetaTrader 5 that automatically identifies high-probability pullback entry zones using the Fibonacci retracement levels of the most recent market swing.
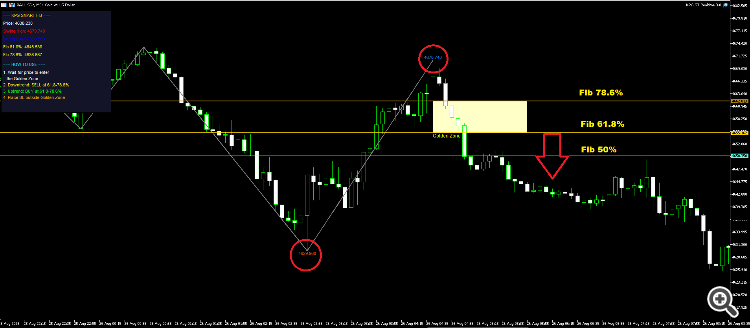
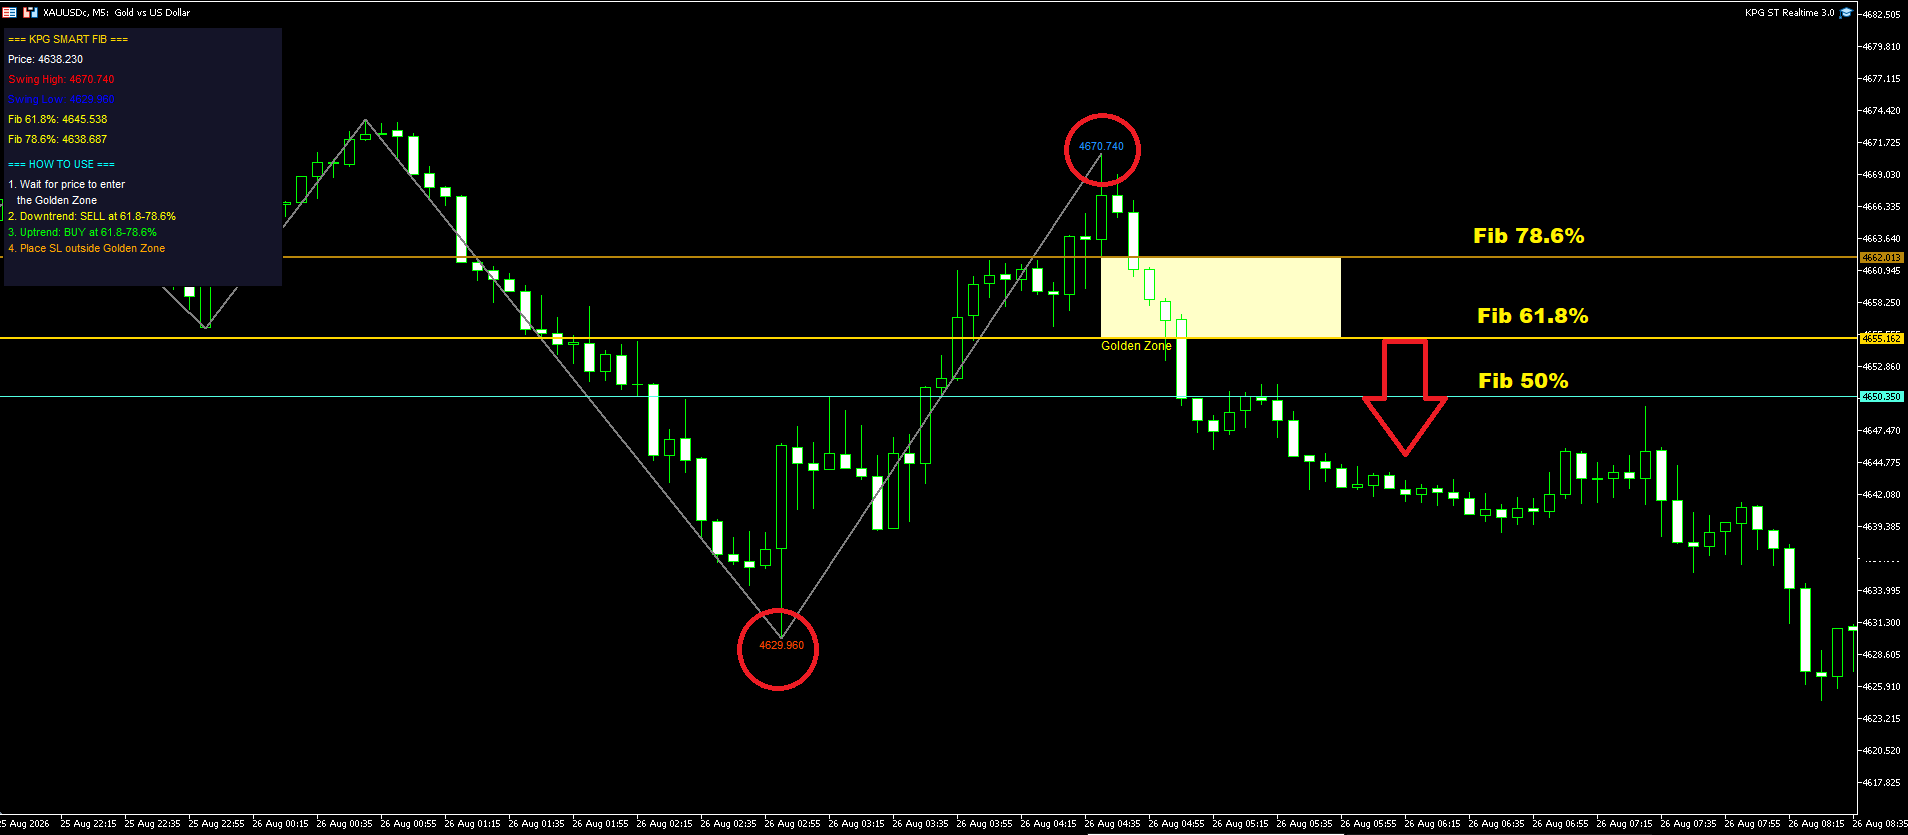
The indicator uses an internal ZigZag algorithm to detect the latest significant swing high and swing low. Based on these two points, it automatically calculates and draws the key Fibonacci retracement levels: 50%, 61.8% and 78.6%. The area between the 61.8% and 78.6% levels is highlighted as the Golden Zone, which is widely considered by traders as an optimal entry area for pullback trades.
The indicator is designed to help traders find entries in the direction of the larger trend. In an uptrend, price is expected to pull back into the Golden Zone before continuing higher. In a downtrend, price is expected to pull back into the Golden Zone before continuing lower.
Main features:
- Automated ZigZag detection. The indicator scans the entire chart history and identifies the most recent swing high and swing low without any manual input.
- Fibonacci retracement levels. The 50%, 61.8% and 78.6% levels are drawn automatically as horizontal lines. The 50% level is shown in a distinct color, while the 61.8% and 78.6% levels are highlighted for easy identification.
- Golden Zone highlighting. The area between the 61.8% and 78.6% levels is filled with a semi-transparent rectangle and labeled "Golden Zone" directly on the chart. This visual aid helps traders quickly spot the optimal entry zone.
- Dashboard panel. A compact dashboard in the top-left corner of the chart displays real-time information including current price, the latest swing high and swing low, the exact Fibonacci levels, and step-by-step usage instructions. This panel helps traders make quick decisions without switching between windows.
- Optional buy and sell signals. When enabled, the indicator can print "Buy Pullback" or "Sell Pullback" labels directly on the chart when price closes inside the Golden Zone. This feature reduces the time spent manually scanning for entries.
- Price labels on swings. The indicator can optionally display the exact price values of the swing high and swing low, making it easy to verify the Fibonacci calculation.
-
Customizable colors and appearance. All colors for the ZigZag lines, Fibonacci levels, Golden Zone fill and labels can be adjusted to match your preferred chart style.

How to use the indicator:
- Apply the indicator to any chart and timeframe. The indicator works on all instruments including forex, indices, commodities and cryptocurrencies.
- Wait for the ZigZag to detect a new swing high and swing low. The Fibonacci levels and Golden Zone will be drawn automatically.
- Look for price to pull back into the Golden Zone.
- In an uptrend, look for price to enter the Golden Zone and show bullish reversal signs.
- In a downtrend, look for price to enter the Golden Zone and show bearish reversal signs.
- Place your stop loss outside the Golden Zone to give the trade room to develop.
- Take profit can be placed at the opposite swing point or based on your preferred risk-to-reward ratio.
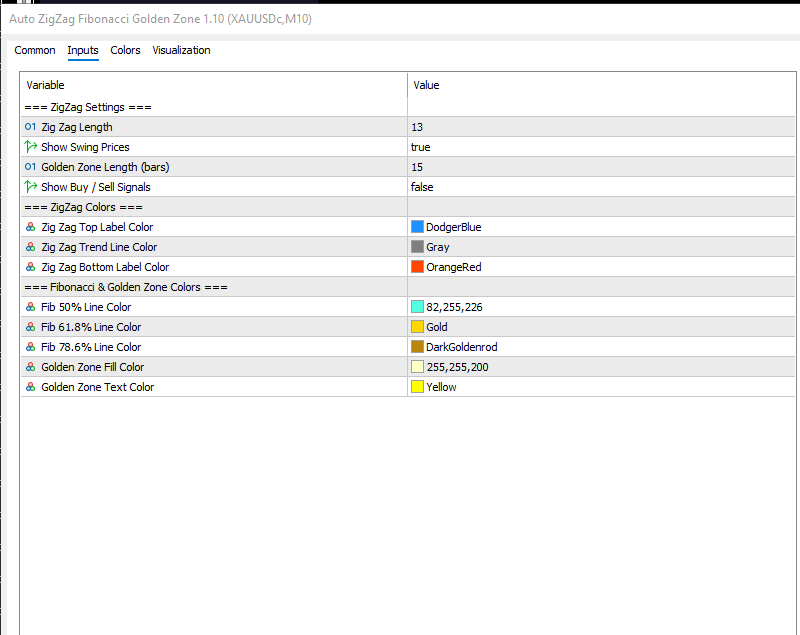
- Zig Zag Length. This parameter controls the sensitivity of the ZigZag detection. A lower value will detect more swings, while a higher value will detect only larger swings. Default is 13.
- Show Swing Prices. When enabled, the indicator displays the exact price of the swing high and swing low on the chart. Default is true.
- Golden Zone Length. This parameter determines how many bars the Golden Zone rectangle extends to the right of the current swing. Default is 15.
- Show Buy/Sell Signals. When enabled, the indicator prints "Buy Pullback" or "Sell Pullback" labels on the chart when price closes inside the Golden Zone. Default is false.
- Zig Zag Top Label Color. The color of the price label shown at the swing high. Default is DodgerBlue.
- Zig Zag Trend Line Color. The color of the ZigZag lines connecting the swings. Default is Gray.
- Zig Zag Bottom Label Color. The color of the price label shown at the swing low. Default is OrangeRed.
- Fib 50% Line Color. The color of the 50% Fibonacci level line. Default is a custom cyan color.
- Fib 61.8% Line Color. The color of the 61.8% Fibonacci level line. Default is Gold.
- Fib 78.6% Line Color. The color of the 78.6% Fibonacci level line. Default is Darkgoldenrod.
- Golden Zone Fill Color. The fill color of the Golden Zone rectangle. Default is a light yellow.
- Golden Zone Text Color. The color of the "Golden Zone" label. Default is Yellow.
Technical notes:
- The indicator does not repaint. All calculations are based on confirmed closed candles. Once a ZigZag swing or Fibonacci level is drawn, it remains fixed until a new swing is detected.
- The Fibonacci levels are calculated using standard Fibonacci ratios: 50%, 61.8% and 78.6%.
- In an uptrend, the Fibonacci levels are measured from the swing low to the swing high. The Golden Zone is the area between 61.8% and 78.6% measured from the bottom.
- In a downtrend, the Fibonacci levels are measured from the swing high to the swing low. The Golden Zone is the area between 61.8% and 78.6% measured from the top.
The indicator works best on higher timeframes such as H1, H4 and Daily, where the Fibonacci levels carry more significance. However, it can be used on any timeframe.
For best results, combine the Golden Zone with additional confirmation tools such as trend lines, support and resistance, or candlestick patterns.
Always test the indicator on a demo account before using it in live trading.
Volume Profile Levels Indicator
Builds a horizontal volume histogram over a recent lookback window and marks the Point of Control and Value Area using the standard TPO/volume value-area expansion algorithm — not just POC ± a fixed offset. Refreshed once per new bar, drawn as a sidebar next to price.
 Sniper Gold Hybrid Recovery EA
XAUUSD M15 basket recovery EA with adaptive ATR spacing, LL/LH structure validation, dynamic RSI gating, crash detection, news filter, and smart trade trimming.
Market Structure Entry Model
Market Structure Shift (CHoCH) Bullish Setup (CHoCH ): Price breaks above the previous confirmed Lower High (LH), signaling a trend reversal from bearish to bullish. Bearish Setup (CHoCH ): Price breaks below the previous confirmed Higher Low (HL), signaling a trend reversal from bullish to bearish.
Support Resistance zig zag based
Support Resistance zig zag based is a Price Action indicator designed to automatically and dynamically map Support, Resistance, and transition areas (Flip Zones) on the chart. It focuses purely on clear price structure mapping and highlighting key bounce areas (SBR & RBS). It also includes an interactive dashboard to monitor real-time market bias.