 MetaTrader 5
 Experts
 Indicators
 Scripts
 Libraries
 Storage
Join our fan page

Volume Profile Levels Indicator - indicator for MetaTrader 5

- Views:
- 3341
- Rating:
- Published:
- Updated:
-
 You are missing trading opportunities:
- Free trading apps
- Over 8,000 signals for copying
- Economic news for exploring financial markets
Registration Log inYou agree to website policy and terms of use
If you do not have an account, please register -
 Need a robot or indicator based on this code? Order it on Freelance
Go to Freelance
Need a robot or indicator based on this code? Order it on Freelance
Go to Freelance

Volume Profile Levels
The idea behind it
A normal chart shows you where price went; a volume profile shows you where the market actually did business. This indicator slices a recent lookback window into equal price rows, tallies how much volume traded at each row, and draws the result as a horizontal histogram sitting beside the price action — the taller the row, the more volume changed hands at that price. From that histogram it derives two of the most widely used reference levels in volume analysis: the Point of Control (the single price level with the most volume) and the Value Area (the price band containing a chosen percentage of total volume, built outward from the POC using the same row-by-row expansion algorithm used in traditional TPO/volume profile analysis, not a naive fixed-percentage-of-range shortcut).
Each histogram row is also split by whether its volume came from up-closing or down-closing bars, so rows are colored by which side dominated — a quick visual cue for whether the acceptance at that price was more buy-driven or sell-driven, on top of the level itself.
How to interpret it
- Histogram rows — length is proportional to volume at that price row relative to the single busiest row; color shows whether up-closing or down-closing bars contributed more volume to that row.
- POC line (default white, solid) — the price row with the single largest volume over the lookback window; often acts as a magnet or a pivot the market returns to.
- VAH / VAL lines (default silver, dotted) — the top and bottom of the Value Area; together they bound the price range where InpValueAreaPercent of all volume traded. Price trading outside this band is, by definition, in a comparatively low-volume, less "agreed-upon" area.
- The sidebar's position — always anchored at the most recent bar, extending to the right; POC/VAH/VAL lines span from the start of the lookback window through the sidebar, so you can see how current price sits relative to them at a glance.
- Refresh timing — with InpUpdateOnNewBarOnly enabled (default), the whole profile rebuilds once per new bar of the chart it's attached to.
External variables (inputs)
| Input | Default | Purpose |
|---|---|---|
| InpLookbackBars | 200 | How many of the most recent bars are included in the profile. |
| InpNumRows | 24 | Number of equal-height price rows (histogram buckets) the lookback range is divided into. |
| InpVolumeType | Tick Volume | Which volume series feeds the histogram: Tick Volume or Real Volume (where the broker supplies it). |
| InpValueAreaPercent | 70.0 | Percentage of total volume the Value Area (VAH to VAL) is built to contain, expanded outward from the POC. |
| InpUpdateOnNewBarOnly | true | When true, rebuilds once per new chart bar; when false, rebuilds on every tick. |
| InpShowProfile | true | Draws the histogram rows (the sidebar itself). |
| InpShowPOC | true | Draws the Point of Control line. |
| InpShowValueArea | true | Draws the Value Area High/Low lines. |
| InpProfileMaxWidthBars | 30 | Sidebar width, in bars-equivalent, for the single busiest row; every other row scales proportionally to it. |
| InpBuyDominantColor / InpSellDominantColor | Lime / Red | Row color depending on whether up-closing or down-closing bars contributed more volume to that row. |
| InpPOCColor | White | Color of the Point of Control line. |
| InpValueAreaColor | Silver | Color of the Value Area High/Low lines. |
Recommended use
Works on any symbol and any timeframe. On symbols with real reported volume, set InpVolumeType to Real Volume for a textbook profile; on most retail forex/metals symbols where brokers only report tick volume, the default Tick Volume approximates trading activity reasonably well but is not literally traded size — the same caveat that applies to any volume-based indicator on these symbols.
This indicator makes one deliberate simplification worth knowing: each bar's entire volume is assigned to a single price row using that bar's typical price (H+L+C)/3, rather than spread across every row the bar's high-low range touches. This keeps the rebuild cost bounded and predictable (proportional to InpLookbackBars, never the chart's full history), at the cost of slightly less granularity than a full range-weighted profile — a reasonable trade-off for a chart-window overlay refreshed every bar rather than a dedicated profile-only sub-window.
This indicator only reads price and volume data and never places, modifies, or closes any order, so it is safe to run on any account type. All chart objects are created under a single internal name prefix and are fully removed via ObjectsDeleteAll() in OnDeinit() when the indicator is detached, so it leaves nothing behind on the chart.
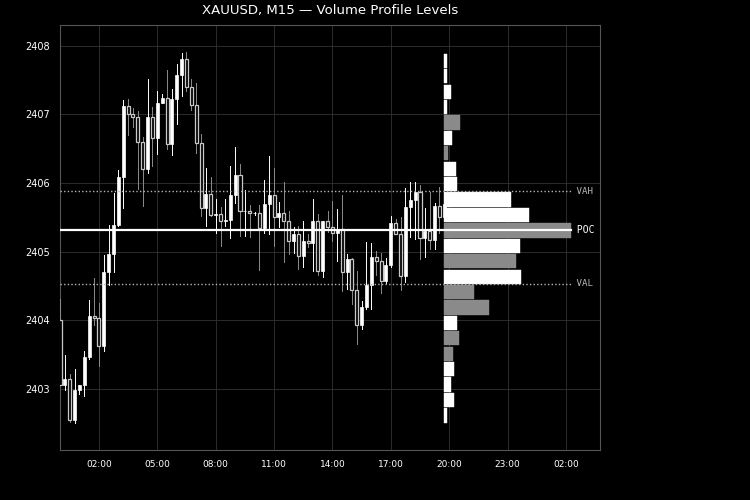
Fig. 1. The volume profile sidebar with POC and Value Area on XAUUSD M15. Rendered in black and white per the Code Base image guidelines (750×500 px).
 Sniper Gold Hybrid Recovery EA
XAUUSD M15 basket recovery EA with adaptive ATR spacing, LL/LH structure validation, dynamic RSI gating, crash detection, news filter, and smart trade trimming.
SessionRangeBreakout
Asian range indicator with breakout levels for the London session. Entry arrows, alerts, push notifications. Optimised for XAUUSD M15.
Auto ZigZag Fibonacci Golden Zone Indicator For MT5
The Auto ZigZag Fibonacci Golden Zone indicator automatically detects the latest swing high and low, draws key Fibonacci retracement levels (50%, 61.8%, 78.6%), and highlights the Golden Zone between 61.8% and 78.6% as an optimal pullback entry area. The indicator includes a real-time dashboard, optional buy/sell signals, and full color customization. Works on all symbols and timeframes. Always test on a demo account before live trading.
Market Structure Entry Model
Market Structure Shift (CHoCH) Bullish Setup (CHoCH ): Price breaks above the previous confirmed Lower High (LH), signaling a trend reversal from bearish to bullish. Bearish Setup (CHoCH ): Price breaks below the previous confirmed Higher Low (HL), signaling a trend reversal from bullish to bearish.