 MetaTrader 5
 Experts
 Indicators
 Scripts
 Libraries
 Storage
Watch how to download trading robots for free
Find us on Twitter!
Join our fan page
Join our fan page
You liked the script? Try it in the MetaTrader 5 terminal

ASQ Divergence Detector - indicator for MetaTrader 5
Muharrem Rogova

Founder of AlgoSphere Quant — building a complete ecosystem of rule-based MT5 trading tools.
Our philosophy: market structure first, strict risk management always, zero martingale.
We build for traders who trade with discipline — not with hope.
──────────────────────────
EXPERT ADVISORS
Our philosophy: market structure first, strict risk management always, zero martingale.
We build for traders who trade with discipline — not with hope.
──────────────────────────
EXPERT ADVISORS
- Views:
- 3016
- Rating:
- Published:
- Updated:
-
 You are missing trading opportunities:
- Free trading apps
- Over 8,000 signals for copying
- Economic news for exploring financial markets
Registration Log inYou agree to website policy and terms of use
If you do not have an account, please register -
 Need a robot or indicator based on this code? Order it on Freelance
Go to Freelance
ASQ Divergence Detector — Spot Reversals Before They Happen
AlgoSphere Quant — Precision before profit.
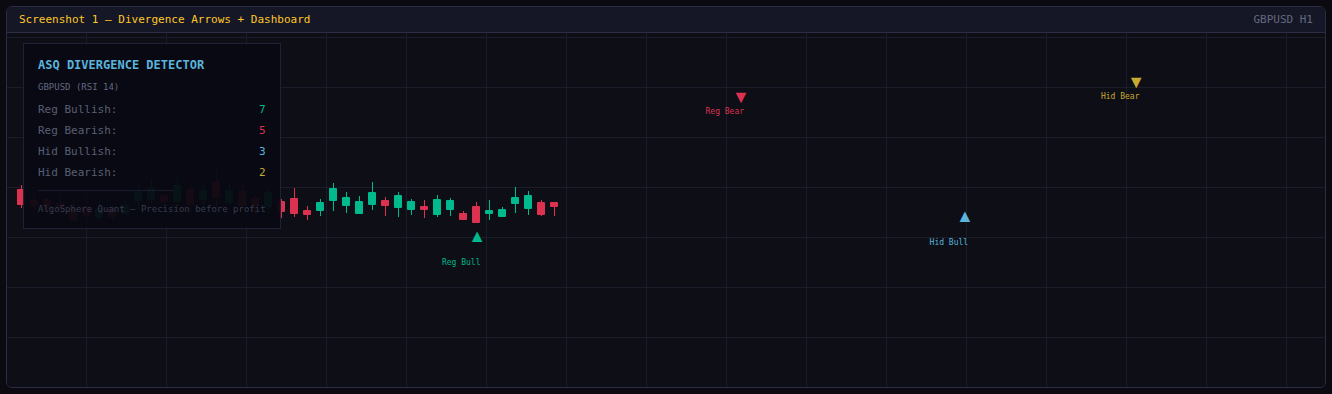
ASQ Divergence Detector scans your chart for regular and hidden RSI divergences and marks them with color-coded, non-repaint arrows. Each arrow is labeled with its type — Regular Bullish, Regular Bearish, Hidden Bullish, or Hidden Bearish — so you never have to guess what the signal means.
A clean on-chart dashboard tracks the count of each divergence type in real time, giving you a statistical overview of how many bullish vs bearish signals have appeared on the current timeframe.
Features
- Non-repaint divergence arrows on the main chart
- Four divergence types: Regular Bullish, Regular Bearish, Hidden Bullish, Hidden Bearish
- Color-coded arrows: green (reg bull), red (reg bear), blue (hid bull), gold (hid bear)
- Text labels at each divergence point showing the type
- Stats dashboard with running count per type
- Configurable swing length, lookback depth, and RSI period
- Alert popup, sound, and push notification on new divergence
- Minimal CPU usage — single-file, no external dependencies
Parameters
Detection: Swing length, lookback bars, RSI period, show regular on/off, show hidden on/off, show labels on/off. Alerts: Popup, sound, push notification. Dashboard: Show on/off, position, font size, colors.
Installation
- Download ASQ_DivergenceDetector.mq5
- Place in MQL5/Indicators/
- Compile in MetaEditor
- Drag onto any chart
MetaTrader 5, all brokers, all instruments, all timeframes. Free and open-source.
 Institutional Cumulative Volume Delta (CVD)
An advanced order flow engine that approximates tick-by-tick aggressor data to calculate the true Cumulative Volume Delta, it exposes institutional absorption and divergence hidden within standard price candles.
Institutional Z-Score Statistical Reversion
A professional quantitative oscillator that replaces traditional retail momentum indicators like the RSI, it calculates the statistical standard deviation of price action to identify mathematically exhausted reversals.
Candle Body Ratio
An original indicator designed to analyze price action and provide buy/sell signals.
 Portfolio Scorer — Multi-EA Correlation and Coverage Analyzer
Portfolio Scorer is a standalone MQL5 script that evaluates the quality of a multi-EA portfolio across three critical dimensions that most algo traders overlook. The script reads daily profit and loss data from CSV files (one per Expert Advisor), computes a full Pearson correlation matrix between every strategy pair, maps trading activity by UTC hour and weekday, detects asset class diversity, and produces a weighted composite score with a letter grade from A+ to F. How it works: The tool runs in four sequential stages. First, the Data Loader reads and validates CSV files containing daily returns for each EA in the portfolio. Second, the Correlation Engine calculates the complete NxN Pearson correlation matrix and flags pairs that exceed a configurable threshold. Third, the Coverage Analyzer maps which hours and weekdays have active trading and identifies blind spots. Fourth, the Scoring Function combines all three dimensions into a single composite score using adjustable weights.