Join our fan page
- Views:
- 24774
- Rating:
- Published:
- Updated:
-
Need a robot or indicator based on this code? Order it on Freelance Go to Freelance
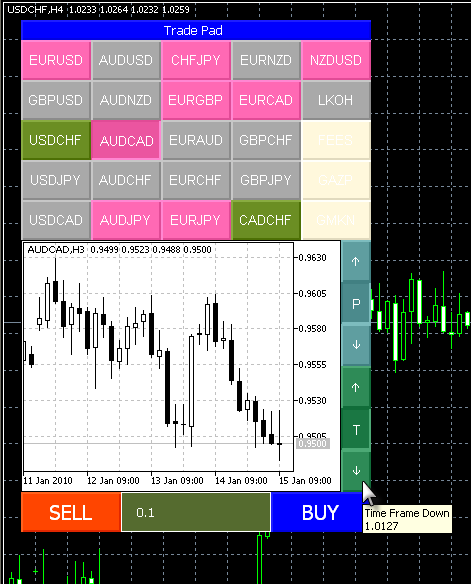
Here are some examples of objects implementation to build a table of trade symbols. By pressing the symbol on graphic object Chart (OBJ_CHART) the price data of this symbol are loaded. Each symbol panel has color that shows the current trend of the timeframe specified. The colors are:
- Red color - downtrend (value of Stohastic > 80);
- Green color - uptrend (value of Stohastic < 20);
- Grey color - flat (the value of Stohastic between 20 and 80);
- Sand color - the price data on the symbol are absent.
The trading functions for the buttons Buy and Sell is not implemented, you can do it yourself as you need. The function for trend determination GetColorOfSymbol () also can be rewritten as you like. The code was written long ago, and quite possibly not optimized (especially for access to the indicator and price data). All the classes used are included, put them in the same folder with TradePad_Sample.mq5 expert.

Translated from Russian by MetaQuotes Ltd.
Original code: https://www.mql5.com/ru/code/68
 ObjChartSample
The script illustrates control of chart properties using the classes from the Standard Library (CChart).
 SphereSample
The script illustrates control of graphic objects using the classes from the Standard Library.
 Fractal Adaptive Moving Average (FrAMA)
The advantage of FRAMA is the possibility to follow strong trend movements and to sufficiently slow down at the moments of price consolidation.
 Double Exponential Moving Average (DEMA)
It is used for smoothing price series and is applied directly on a price chart of a financial security.
