Join our fan page

Candle Replay Magnifier - indicator for MetaTrader 5

- Views:
- 7025
- Rating:
- Published:
- Updated:
-
 You are missing trading opportunities:
- Free trading apps
- Over 8,000 signals for copying
- Economic news for exploring financial markets
Registration Log inYou agree to website policy and terms of use
If you do not have an account, please register -
 Need a robot or indicator based on this code? Order it on Freelance
Go to Freelance
Need a robot or indicator based on this code? Order it on Freelance
Go to Freelance
Features:
- Overlay candles from any past date directly onto the current chart.
- Automatic adjustment of replay zone/magnifier to match live chart movement.
- Dynamic tooltips showing:
- Time.
- Open, High, Low, Close.
- Candle Range.
- Bullish/Bearish direction.
- Volume.
- Customizable colors for bullish/bearish candles and zones.
- Interactive zone for selecting and dragging overlay region.
- Works on intraday timeframes (e.g. M1 to H1).
Parameters:
| Parameter Name | Description |
|---|---|
| InpReplayDate | Date to fetch historical candles from. |
| InpMainZoneColor | Color for the main live zone rectangle. |
| InpReplayZoneColor | Color for the replay overlay zone. |
| InpBullColor | Color for bullish replay candles. |
| InpBearColor | Color for bearish replay candles. |
How to Use:
A simple step-by-step guide:
- Attach the indicator to a chart (preferable intraday).
- Select the Replay Date using input panel.
- The indicator will draw a red "Main Zone" on your current chart.
- A green "Replay Zone" will display historical candles mapped to the same relative position and size.
- Hover over the replay bars to see candle details.
What's inside the Zones?
- The first candle in the Main Zone (on the left) corresponds to the first candle from the selected ReplayDate.
- The current live candle (on the right of the red zone) is aligned with the last candle of the green Replay Zone.
- This lets you easily see:
- "How did the market behave at this position last time?".
- "Are we repeating a similar pattern?".
What's around my current Candlestick?
- The current candlestick (last bar in the red Main Zone) corresponds exactly to the last candle in the green Replay Zone - they are aligned in both time position and open price.
- The first candle on the left of the Main Zone is matched to the first candle of the Replay Zone (from the selected ReplayDate).
- The last (current) candle of the Main Zone is matched to the last candle from the Replay Zone - their opening prices are identical for comparison.
- This lets you answer:
- "What did price do next the last time we were at the same level and time of day?".
Notes and Limitations:
- Zone Range: Large replay ranges may impact performance on low-end devices.
- No Wicks: Only candle bodies are drawn, upper and lower shadows are not shown.
- No buffers: This indicator uses only chart objects (rectangles), not indicator buffers.
- Redraws every new bar: The full replay zone is re-rendered on each new tick or bar, which is not optimized for performance.
- Market Closed on Replay date: If the market was closed on the selected ReplayDate, no candles will appear.
- Replay Offset Risk: If some bars are missing on the replay date, the green replay zone may misalign, and the current candle's open price may not match the replay candles open price.
- Only intraday timeframes supported: This tool is designed for intraday use (below daily timeframe). Not intended for D1/W1/M1.
Screenshots:
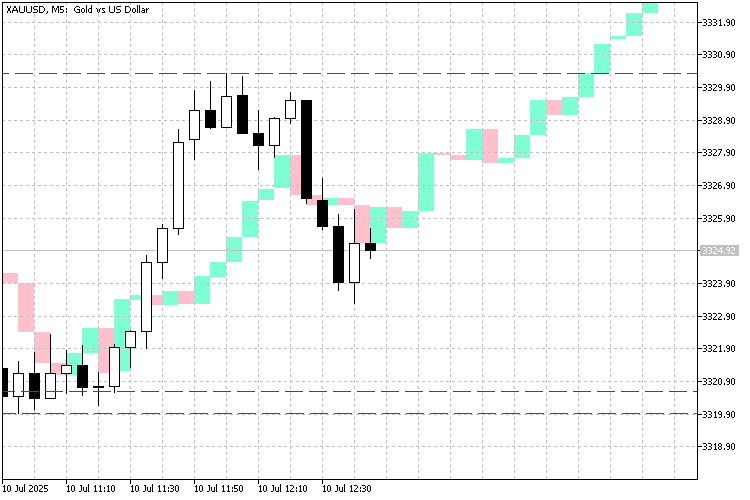
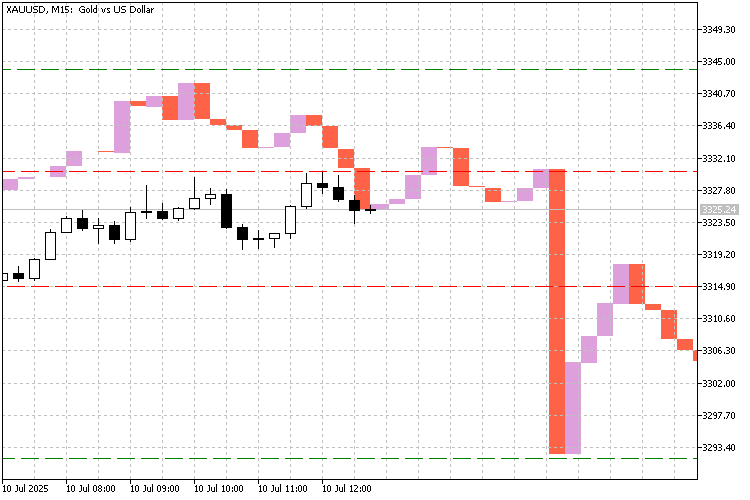
Conclusion:
Whether you're a pattern trader, scalper, or just want to visually compare market behavior, this tool adds a new perspective to your analysis. Give it a try and let me know what you think! Check And Delete Chart Object Script
Script
 Pending tread EA (Best for Gold)
The Pending_tread EA is a versatile and easy-to-use trading robot designed to automate the placement and management of multiple pending orders arranged in a grid pattern above and below the current market price. This EA is well-suited for scalping strategies and can operate on any timeframe or currency pair, making it highly flexible for various trading styles.
 Period Converter Mod
An analogue of Period Converter in MT4
Quick Chart Setter: Instant Color Themes for MT5 Traders
A quick little script to make traders' lives easier. The one thing that always annoys me is resetting the properties like colors for a new chart, to make it look the way i like it. So Here is a script to make things smoother.