 MetaTrader 5
 Experts
 Indicators
 Scripts
 Libraries
 Storage
Watch how to download trading robots for free
Find us on Telegram!
Join our fan page
Join our fan page
You liked the script? Try it in the MetaTrader 5 terminal

Value Charts - indicator for MetaTrader 5

- Views:
- 24860
- Rating:
- Published:
- Updated:
-
 You are missing trading opportunities:
- Free trading apps
- Over 8,000 signals for copying
- Economic news for exploring financial markets
Registration Log inYou agree to website policy and terms of use
If you do not have an account, please register -
 Need a robot or indicator based on this code? Order it on Freelance
Go to Freelance
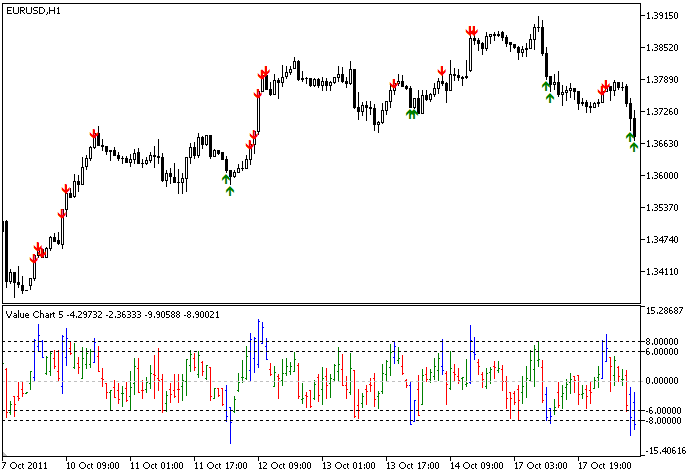
Value Charts is a detrended price indicator created by David Stendhal, it shows the overbought and oversold states using the detrended price extremes.
For a nice description, see the "Dynamic Trading Indicators: Winning with Value Charts and Price Action Profile" book Mark Helweg and David Stendahl, this book is very good.
SuperTrend
SuperTrend indicator.
SHI Channel true (NB-channel)
SHI_Channel_true automatically shows Barishpolts dynamic moving channels on a chart.
3LineBreak
The indicator that paints the bars in blue for a bullish trend and in red for a bearish one.
ASCtrend
The indicator generates signals for entering the market.