Join our fan page
- Views:
- 6392
- Rating:
- Published:
- Updated:
-
Need a robot or indicator based on this code? Order it on Freelance Go to Freelance
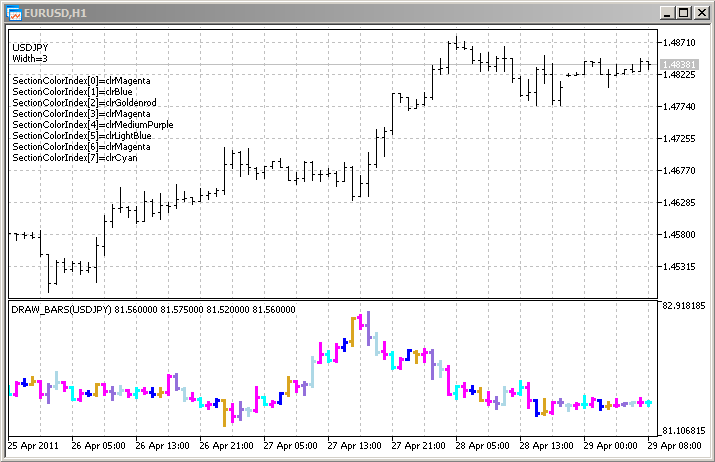
An example of indicator, that draws bars for the specified instrument in a separate window.
The color of bars changes randomly every N ticks. The N parameter of indicator is made as external so that you can adjust it manually (the Inputs tab of indicator properties dialog box). Note, that initially there are 8 colors set for the plot1 graphical plotting (with the DRAW_COLOR_BARS style) using the #property compiler directive. Then, in the OnCalculate() function the color is chosen at random from 14 colors stored in the colors[] array.
See also The Drawing Styles in MQL5 article.

Translated from Russian by MetaQuotes Ltd.
Original code: https://www.mql5.com/ru/code/348
 DRAW_COLOR_ZIGZAG
The DRAW_COLOR_ZIGZAG style draws lines of different colors by values of two indicator buffers. This is the color version of the DRAW_ZIGZAG style and allows you to specify individual color for each line from predefined color set.
 DRAW_COLOR_ARROW
The DRAW_COLOR_ARROW drawing style plots the color arrows (symbols from Windings font).
 DRAW_COLOR_CANDLES
The DRAW_COLOR_CANDLES style (as DRAW_CANDLES) draws candlesticks based on values of four indicator buffers, containing Open, High, Low and Close prices. In additions it allows you to specify color for each candlestick from a given set.
 Kaufman Volatility
Kaufman Volatility indicator according to Perry Kaufman book "Smarter Trading: Improving Performance in Changing Markets".