Watch how to download trading robots for free
Find us on Twitter!
Join our fan page
Join our fan page
You liked the script? Try it in the MetaTrader 5 terminal

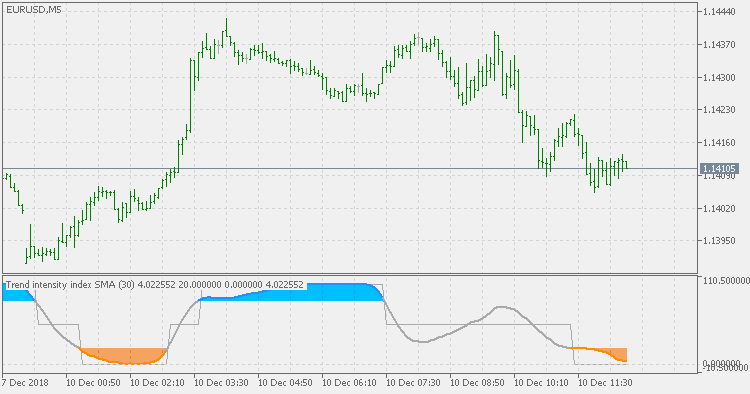
Trend intensity index - indicator for MetaTrader 5

- Views:
- 12719
- Rating:
- Published:
-
 You are missing trading opportunities:
- Free trading apps
- Over 8,000 signals for copying
- Economic news for exploring financial markets
Registration Log inYou agree to website policy and terms of use
If you do not have an account, please register -
 Need a robot or indicator based on this code? Order it on Freelance
Go to Freelance
Need a robot or indicator based on this code? Order it on Freelance
Go to Freelance
Theory :
It was created by M.H.Pee. The definition (in short) is the following :
To calculate a 30-day trend intensity index (TII), follow these steps:
- Obtain the 60-day simple moving average by adding the closes for the past 60 days and dividing the result by 60.
- Find the deviation of each of the recent 30 closes from the 60-day moving average. The deviation is up if the close is above the moving average, and down when the close is below the average. Up deviation values are obtained by subtracting the moving average from the close, while down deviations are calculated by subtracting the close from the moving average. The TII allows you to find out what percentage of these deviations is up or down. For a 30-day TII , you should have 30 deviations from the 60-day moving average.
Usage :
You can use color changes as signals
 Trade signal based on PullBack and Candle (for MQL5 Wizard)
This is the trading signal of PullBack and Candle. The expert code for this strategy is automatically generated by the MQL 5 wizard.
Trend detection index
Trend detection index
Phase change index 2
Phase change index 2
BB stops - Hull average
BB stops - Hull average based with multiple stops included