Join our fan page

RSX range expansion index - with confidence bands - indicator for MetaTrader 5

- Views:
- 6396
- Rating:
- Published:
-
 You are missing trading opportunities:
- Free trading apps
- Over 8,000 signals for copying
- Economic news for exploring financial markets
Registration Log inYou agree to website policy and terms of use
If you do not have an account, please register -
 Need a robot or indicator based on this code? Order it on Freelance
Go to Freelance
Need a robot or indicator based on this code? Order it on Freelance
Go to Freelance
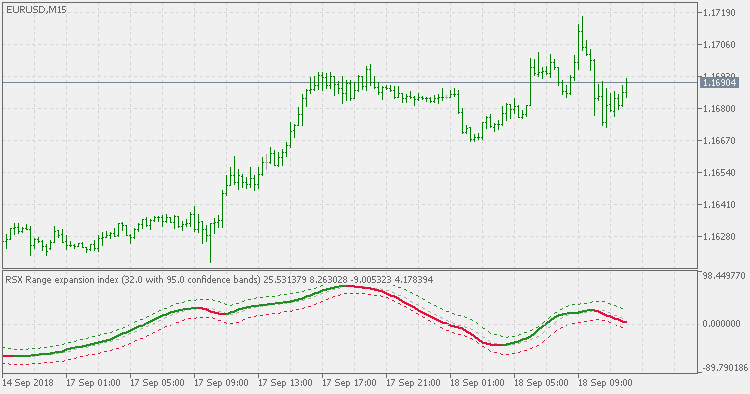
Range Expansion Index (REI) definition :
Range Expansion Index (REI) is an
oscillator that measures price changing rate and signals about
overbought/oversold areas, in case a price shows weakness or strength.
It was developed by Thomas DeMark and described in his book "The New Science of Technical Analysis".
The indicator values change from -100 up to +100. REI is an enhanced oscillator, as it stays neutral during a flat and shows trends only when considerable top or bottom have been reached.
This version :
This version is made according to Mark Jurik's idea : according to him, REI can be made as rsx(high) + rsx(low) - and the result should be much smoother. So, this version is doing exactly that.
Also, this version is adding a bit modified confidence bands in order to make the trend changes spotting easier (some more information on confidence bands you can find here : Confidence and prediction bands). One parameter needs an explanation - the confidence bands shift :
It is the number of bars that the bands are shifted in order to provide usable crosses of REI value and confidence bands. Without it, the results would be illogical, and that is the reason why the indicator limits the minimal shift to +1. The greater the shift, the more the bands are shifted but some experimenting is recommended (mild shifting is producing quite good results)
You have an option to chose between two color changing modes :
- color change when outer levels are crossed
- color change when middle level (a sort of a "zero line") is crossed - that is the default mode
Usage :
In this version use color changes change as potential trend start and end signals
RSX range expansion index - with floating levels
RSX range expansion index - with floating levels
RSX range expansion index
RSX range expansion index
Volatility Indicator
Great indicator for Time series analysis as shows stationary properties. Indicator calculates the difference between a 14 period Double exponential moving average and price closes. Great to help identify unusual price activity.
Step chart of RSX of average
Short description.