Join our fan page

- Views:
- 65272
- Rating:
- Published:
- Updated:
-
 You are missing trading opportunities:
- Free trading apps
- Over 8,000 signals for copying
- Economic news for exploring financial markets
Registration Log inYou agree to website policy and terms of use
If you do not have an account, please register -
 Need a robot or indicator based on this code? Order it on Freelance
Go to Freelance
Need a robot or indicator based on this code? Order it on Freelance
Go to Freelance
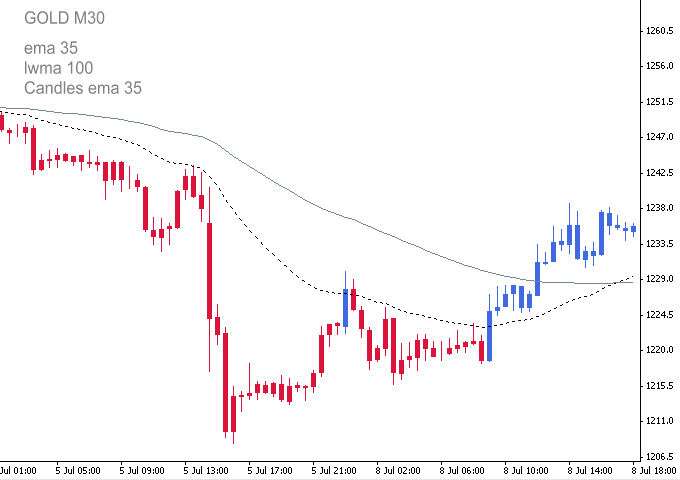
MA Candles Two Colors 2.0: Also available for MetaTrader 5
This indicator draws different colored candles above and below a Moving Average (MA) line.
Supported MA methods:
- Simple
- Exponential
- Smoothed
- Weighted
- Triangular *.
The indicator includes all standard parameters of MA: Period, Shift, Method and Price.
* Triangular MA indicator is included — see attached download files.
The user is required to ensure that all Inputs Variables and Value parameters (MA Period, Shift, Method and Price) on both the present Indicator and the user provided Moving Average match each other exactly.
- Open a new chart.
- Change the chart price graphic to Line Chart - Press (Alt + 3) or locate 'Charts' on top menu and select 'Line Chart'. Make sure that 'Bar Chart' or 'Candlesticks' is not accidentally selected.
- Open the Chart Properties window - press (F8) or right click anywhere on the chart and select 'Properties'.
- Select the Colors tab.
- Select 'Line Chart:', now select the '▼' and change color to 'None'. The chart should now have no graphical price displayed and is referred to as the blank chart.
- A template of the blank chart can be made for further use with other currency pairs or instruments.
- Attach Indicator Color Candles cross MA to the blank chart.
The default parameters for MA1 are: Period = 1, Shift = 0, Method = 0 (SMA), Price = 0 (Close). This is the equivalent of having the color candles change color on price close above or below MA2.
The default method for MA2 is EMA.
Note: MAs to be supplied by user and not part of Indicator.
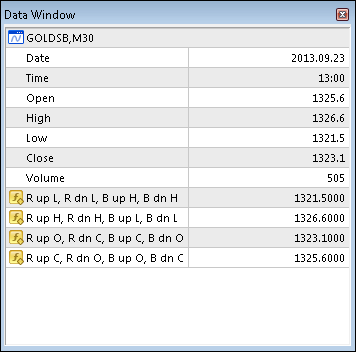
Candle Accuracy: Although the standard chart price graphic is hidden it is not disabled and Open, High, Low and Close prices are available in MetaTrader 4 Data Window (press Ctrl+D or View → Data Window). Accuracy of the Indicators Open, High, Low and Close can be checked against Open, High, Low and Close in MetaTrader 4 Data Window. When cross-referencing the cursor point must be on the relevant colored candle:
Interpretation of the Data Windows:
- The hidden candle Open: 1325.6
- The hidden candle High: 1326.6
- The hidden candle Low: 1321.5
- The hidden candle Close: 1323.1
The indicator candle H, L, O and C are listed in Columns R up, R dn, Bu and B dn (Red up candle, Red down, Blue up candle, Blue down candle).
The hidden candle open is greater than the close so the candle is a down candle. The indicator Red down candle in column 2 corresponds to the hidden down candle.
- R dn L: 1321.5
- B dn H: 1326.6
- R dn C: 1323.1
- R dn O: 1325.6
All Inputs parameters and options can be changed and will save automatically. If after changing Inputs or Color parameters a Reset is used the Color Candles will display as Bars. To revert to Color Candles switch to a different timeframe and then back.
Input and Parameters:- Candle _MA_Period - 34;
- Candle_MA_ Shift - 0;
- Candle_MA_Type - 1;
- Candle_MA_Price - 0;
- Candle_Shadow_Width - 1;
- Candle_Body_Width - 4;
- Type_Key - 0: SMA, 1: EMA, 2: SMMA, 3: LWMA;
- Price_Key - 0: Close, 1: Open; 2: High;
- Price_Key_cont - 3: Low, 4: Median;
 Kijun Sen Candles Two Colors
This Indicator draws different color candles above and below a Kijun Sen line.
Color Fill - Tenkan + Kijun
Draws Tenkan and Kijun with Color Fill between 1. Price and Tenkan, 2. Price and Kijun, 3. Tenkan and Kijun and 4. No Fill.
 NewsTradingEA
EA for Trading on News event, will set BUY and SELL Stop (pending order) then will delete one pending order after open BUY/SELL occur (OCO) on specifed date and time.
 Open chart
With 3 settable parameters (currency pair, timeframe, and template) opens a new chart on your screen at the initalization period of the script.