Grid Core Fractal Adaptive Moving Average EA: M1 Scalping Back Test Results on 28 Forex Pairs (High Risk, 2020-2026)

Contents
- Introduction
- What is Grid Core Fractal Adaptive Moving Average EA
- How to use it properly
- How the back tests were done
- Why 2020 to 2026?
- The buffer rule
- Risk warning
- Summary tables (cent and standard)
- Scalpers: M1: pair by pair
- Stack many pairs
- The other timeframes
- Final disclaimer
Introduction
This back test review shows what Grid Core Fractal Adaptive Moving Average EA did on 28 forex pairs from 2020.01.01 to 2026.10.08. This part covers Scalpers: M1: 23 profitable setups, every one with its report and graph, for a cent account and a standard account. Quick picks by yearly %: GBPCAD M1 (22% a year), AUDCAD M1 (18% a year), USDCHF M1 (12% a year). The other timeframes: Stable trading: H4 and H1 and Active trading: M30 and Active trading: M15 and Scalpers: M5. Everything is according to the back test; past results do not guarantee future results.
What is Grid Core Fractal Adaptive Moving Average EA?
Get Grid Core Fractal Adaptive Moving Average EA here. It is a grid Expert Advisor for MetaTrader 5 built on the Fractal Adaptive Moving Average, a line that changes its own speed: it hugs price when the move is clean and goes slow and flat when the market is noisy. A BUY cycle starts when price crosses back above the adaptive line, when the line turns up with enough slope, or both (your choice); SELL is the mirror. Only closed bars are read, a minimum slope filter skips flat stretches and a 30-bar signal delay stops it from arming cycle after cycle in chop.
After the start, a complete grid engine manages the book: profits are taken by groups of the oldest and newest orders, a heavy old order is retired in partial slices, and protection filters (spread, margin level, floating loss, maximum orders) are visible inputs. It works on hedging and netting accounts.
How to use it properly
- Choose a trading pair and timeframe from the provided tables, then attach the Grid Core Fractal Adaptive Moving Average EA to that chart.
- Begin with a demo or cent account using the smallest lot size. For standard accounts, use the capital amount specified.
- Always keep your capital in the buffer. Never risk money you can't afford to lose.
- Use one chart per trading pair and assign a unique magic number to each chart.
- Ensure the EA runs on a VPS to operate continuously.
- Test the Grid Core Fractal Adaptive Moving Average EA on your own account.
Try Grid Core Fractal Adaptive Moving Average EA on your own account
How the back tests were done (reproduce them yourself)
This is a back test review: a simulation on historical data, not a live account statement.
- MetaTrader 5 Strategy Tester, broker RoboForex-Pro, 2020.01.01 - 2026.10.08 (about 6.8 years), delay 500 ms, leverage 1:500, optimization off.
- Model "Every tick based on real ticks" with the broker’s real spreads; swaps are included by the tester. For AUDCAD, AUDJPY, AUDNZD, and EURCAD, the broker’s real-tick history starts late, so "Every tick" generated from complete 1-minute bars was used.
- Inputs changed from default: MaxOrderVolume = 1.0, ProfitTargetMode = Scaled, DesiredProfitPerClosure = 2.0. Everything else default, so you can repeat any test in your own tester.
- Only runs with 99-100% history quality were accepted.
- Total profit = Total Net Profit. Equity drawdown = Equity Drawdown Maximal, the base of the needed capital. Cent account = tested numbers / 100, standard account = tested numbers.
- A high profit can come with a high drawdown: always read both.
Why 2020 to 2026?
These years were chosen deliberately for their volatility, ensuring a rigorous test for any grid trading strategy:
- 2020: the global shock of the COVID-19 crash, unprecedented central bank stimulus, oil prices plummeting to historic lows, and the political backdrop of the US election.
- 2021-2022: the inflation and supply chain disruptions, the Russia-Ukraine conflict and ensuing energy crisis, the Federal Reserve's aggressive rate hikes, the UK's economic turmoil, and the yen's intervention.
- 2023: the financial instability triggered by SVB and Credit Suisse failures, and the Israel-Hamas conflict.
- 2024: the Bank of Japan's shift away from negative interest rates, followed by the August yen carry-trade collapse.
- 2025-2026: potential tariff shocks and emerging conflicts in the Middle East.
The buffer is a must
Every capital figure here is the equity drawdown plus a buffer: +25% = minimum, +50% = good, +100% = best. Never start below the minimum; the best level is the safest. Monthly and yearly % are quoted on the good (+50%) level. This applies to cent and standard accounts alike.
Risk warning for faster timeframes
- Faster timeframes like M5 and M1 increase the number of grid levels, leading to larger drawdowns and higher capital requirements.
- These timeframes are for experienced traders only.
- Always use a buffer of at least +100% if you are uncertain.
Summary tables
Sorted by yearly %, highest first. Capital columns: +25% minimum, +50% good, +100% best.
CENT account
| Pair | TF | Total profit | Equity drawdown | +25% min | +50% good | +100% best | Monthly | Yearly | Daily |
|---|---|---|---|---|---|---|---|---|---|
| GBPCAD | M1 | $3,391 | $1,519 | $1,899 | $2,278 | $3,038 | 1.8% | 22% | $1.37 |
| AUDCAD | M1 | $1,285 | $700 | $875 | $1,050 | $1,400 | 1.5% | 18% | $0.52 |
| USDCHF | M1 | $2,216 | $1,746 | $2,183 | $2,619 | $3,493 | 1.0% | 12% | $0.90 |
| EURUSD | M1 | $2,242 | $1,787 | $2,233 | $2,680 | $3,573 | 1.0% | 12% | $0.91 |
| CHFJPY | M1 | $3,456 | $2,984 | $3,730 | $4,476 | $5,968 | 1.0% | 11% | $1.40 |
| EURCHF | M1 | $1,168 | $1,080 | $1,350 | $1,620 | $2,160 | 0.9% | 11% | $0.47 |
| AUDUSD | M1 | $1,964 | $2,337 | $2,921 | $3,505 | $4,674 | 0.7% | 8.3% | $0.79 |
| NZDUSD | M1 | $1,823 | $2,411 | $3,013 | $3,616 | $4,821 | 0.6% | 7.4% | $0.74 |
| EURJPY | M1 | $3,120 | $4,305 | $5,382 | $6,458 | $8,611 | 0.6% | 7.1% | $1.26 |
| NZDCAD | M1 | $1,383 | $2,263 | $2,829 | $3,395 | $4,527 | 0.5% | 6.0% | $0.56 |
| EURNZD | M1 | $4,404 | $7,900 | $9,875 | $11,850 | $15,799 | 0.5% | 5.5% | $1.78 |
| GBPNZD | M1 | $4,627 | $8,380 | $10,474 | $12,569 | $16,759 | 0.5% | 5.4% | $1.87 |
| EURGBP | M1 | $1,044 | $1,976 | $2,470 | $2,964 | $3,952 | 0.4% | 5.2% | $0.42 |
| CADCHF | M1 | $1,194 | $2,273 | $2,841 | $3,409 | $4,546 | 0.4% | 5.2% | $0.48 |
| USDCAD | M1 | $1,816 | $3,461 | $4,327 | $5,192 | $6,923 | 0.4% | 5.2% | $0.73 |
| GBPUSD | M1 | $3,407 | $8,145 | $10,181 | $12,218 | $16,290 | 0.3% | 4.1% | $1.38 |
| NZDCHF | M1 | $1,253 | $3,081 | $3,851 | $4,621 | $6,162 | 0.3% | 4.0% | $0.51 |
| GBPAUD | M1 | $4,766 | $12,171 | $15,213 | $18,256 | $24,341 | 0.3% | 3.9% | $1.93 |
| NZDJPY | M1 | $2,041 | $5,242 | $6,552 | $7,863 | $10,484 | 0.3% | 3.8% | $0.83 |
| EURCAD | M1 | $2,887 | $8,407 | $10,508 | $12,610 | $16,813 | 0.3% | 3.4% | $1.17 |
| AUDCHF | M1 | $1,506 | $4,874 | $6,092 | $7,311 | $9,747 | 0.3% | 3.0% | $0.61 |
| AUDJPY | M1 | $2,150 | $7,402 | $9,253 | $11,103 | $14,804 | 0.2% | 2.9% | $0.87 |
| GBPCHF | M1 | $1,868 | $8,388 | $10,485 | $12,583 | $16,777 | 0.2% | 2.2% | $0.76 |
STANDARD account
| Pair | TF | Total profit | Equity drawdown | +25% min | +50% good | +100% best | Monthly | Yearly | Daily |
|---|---|---|---|---|---|---|---|---|---|
| GBPCAD | M1 | $339,118 | $151,881 | $189,851 | $227,822 | $303,762 | 1.8% | 22% | $137.18 |
| AUDCAD | M1 | $128,514 | $69,981 | $87,476 | $104,972 | $139,962 | 1.5% | 18% | $51.99 |
| USDCHF | M1 | $221,590 | $174,632 | $218,290 | $261,948 | $349,264 | 1.0% | 12% | $89.64 |
| EURUSD | M1 | $224,193 | $178,661 | $223,326 | $267,992 | $357,322 | 1.0% | 12% | $90.69 |
| CHFJPY | M1 | $345,587 | $298,408 | $373,010 | $447,612 | $596,816 | 1.0% | 11% | $139.80 |
| EURCHF | M1 | $116,786 | $107,996 | $134,995 | $161,994 | $215,992 | 0.9% | 11% | $47.24 |
| AUDUSD | M1 | $196,426 | $233,694 | $292,117 | $350,540 | $467,387 | 0.7% | 8.3% | $79.46 |
| NZDUSD | M1 | $182,308 | $241,058 | $301,323 | $361,588 | $482,117 | 0.6% | 7.4% | $73.75 |
| EURJPY | M1 | $312,020 | $430,527 | $538,158 | $645,790 | $861,053 | 0.6% | 7.1% | $126.22 |
| NZDCAD | M1 | $138,348 | $226,336 | $282,920 | $339,504 | $452,671 | 0.5% | 6.0% | $55.97 |
| EURNZD | M1 | $440,442 | $789,968 | $987,460 | $1,184,951 | $1,579,935 | 0.5% | 5.5% | $178.17 |
| GBPNZD | M1 | $462,725 | $837,958 | $1,047,448 | $1,256,937 | $1,675,917 | 0.5% | 5.4% | $187.19 |
| EURGBP | M1 | $104,388 | $197,589 | $246,986 | $296,384 | $395,178 | 0.4% | 5.2% | $42.23 |
| CADCHF | M1 | $119,418 | $227,293 | $284,117 | $340,940 | $454,587 | 0.4% | 5.2% | $48.31 |
| USDCAD | M1 | $181,595 | $346,132 | $432,666 | $519,199 | $692,265 | 0.4% | 5.2% | $73.46 |
| GBPUSD | M1 | $340,698 | $814,502 | $1,018,127 | $1,221,753 | $1,629,004 | 0.3% | 4.1% | $137.82 |
| NZDCHF | M1 | $125,256 | $308,093 | $385,116 | $462,139 | $616,185 | 0.3% | 4.0% | $50.67 |
| GBPAUD | M1 | $476,617 | $1,217,069 | $1,521,337 | $1,825,604 | $2,434,138 | 0.3% | 3.9% | $192.81 |
| NZDJPY | M1 | $204,119 | $524,195 | $655,244 | $786,293 | $1,048,391 | 0.3% | 3.8% | $82.57 |
| EURCAD | M1 | $288,667 | $840,656 | $1,050,819 | $1,260,983 | $1,681,311 | 0.3% | 3.4% | $116.77 |
| AUDCHF | M1 | $150,560 | $487,373 | $609,217 | $731,060 | $974,747 | 0.3% | 3.0% | $60.91 |
| AUDJPY | M1 | $215,018 | $740,202 | $925,252 | $1,110,303 | $1,480,404 | 0.2% | 2.9% | $86.98 |
| GBPCHF | M1 | $186,819 | $838,835 | $1,048,544 | $1,258,252 | $1,677,670 | 0.2% | 2.2% | $75.57 |
Scalpers: M1: pair by pair
Same order as the tables. Read the full Grid Core Fractal Adaptive Moving Average EA feature list.
GBPCAD M1
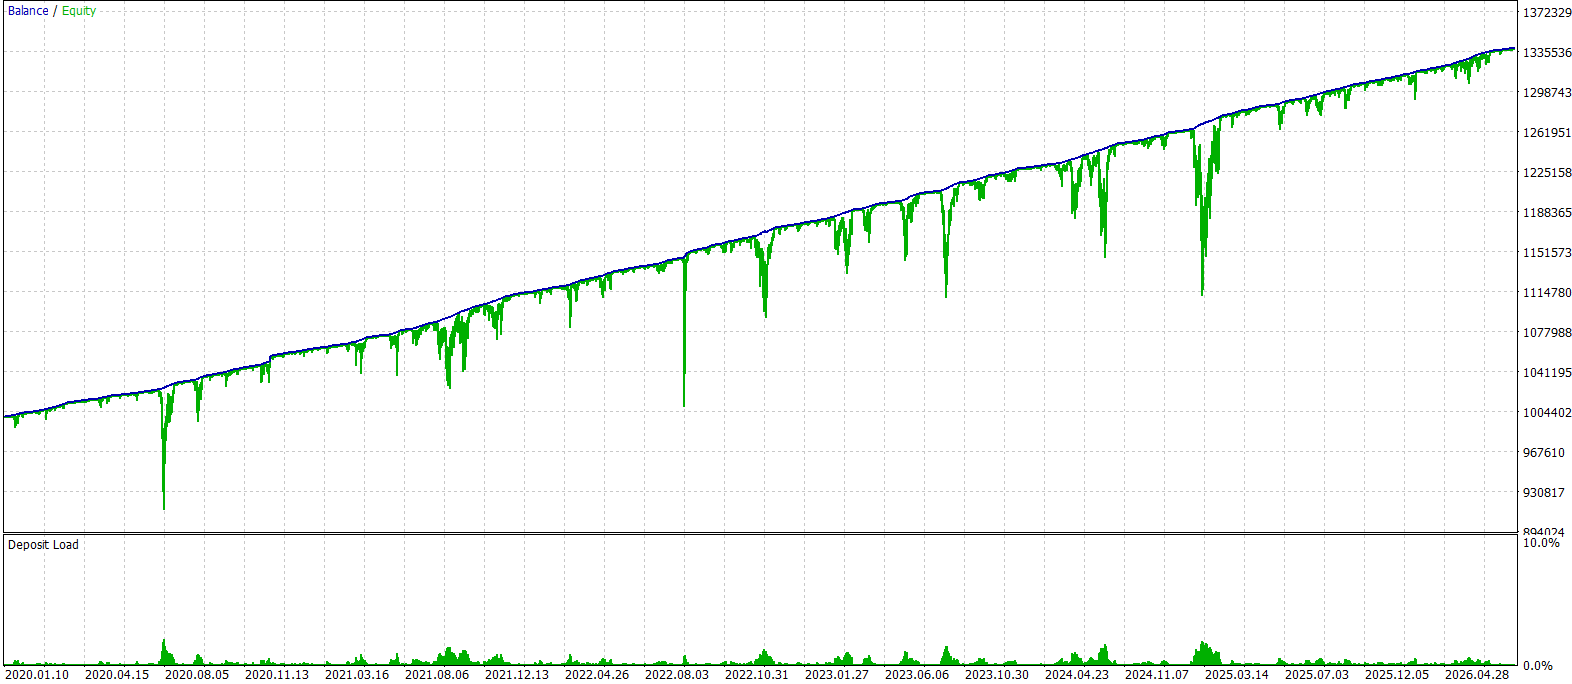
According to the back test (2020-2026), GBPCAD on M1 grew about 22% a year, roughly 1.8% a month, measured on the good (+50%) capital level.
Cent account (the tested figures divided by 100): total profit $3,391 against an equity drawdown of $1,519. Capital to start: minimum $1,899 (+25%), good $2,278 (+50%, recommended), best $3,038 (+100%). That is about $1.37 a day on average - a low-cost way to watch the EA work on your own broker.
Standard account (the tested figures as they are): total profit $339,118 against an equity drawdown of $151,881. Capital to start: minimum $189,851 (+25%), good $227,822 (+50%, recommended), best $303,762 (+100%). That is about $137.18 a day on average. Keep the buffer: the drawdown can come before the profit.

AUDCAD M1
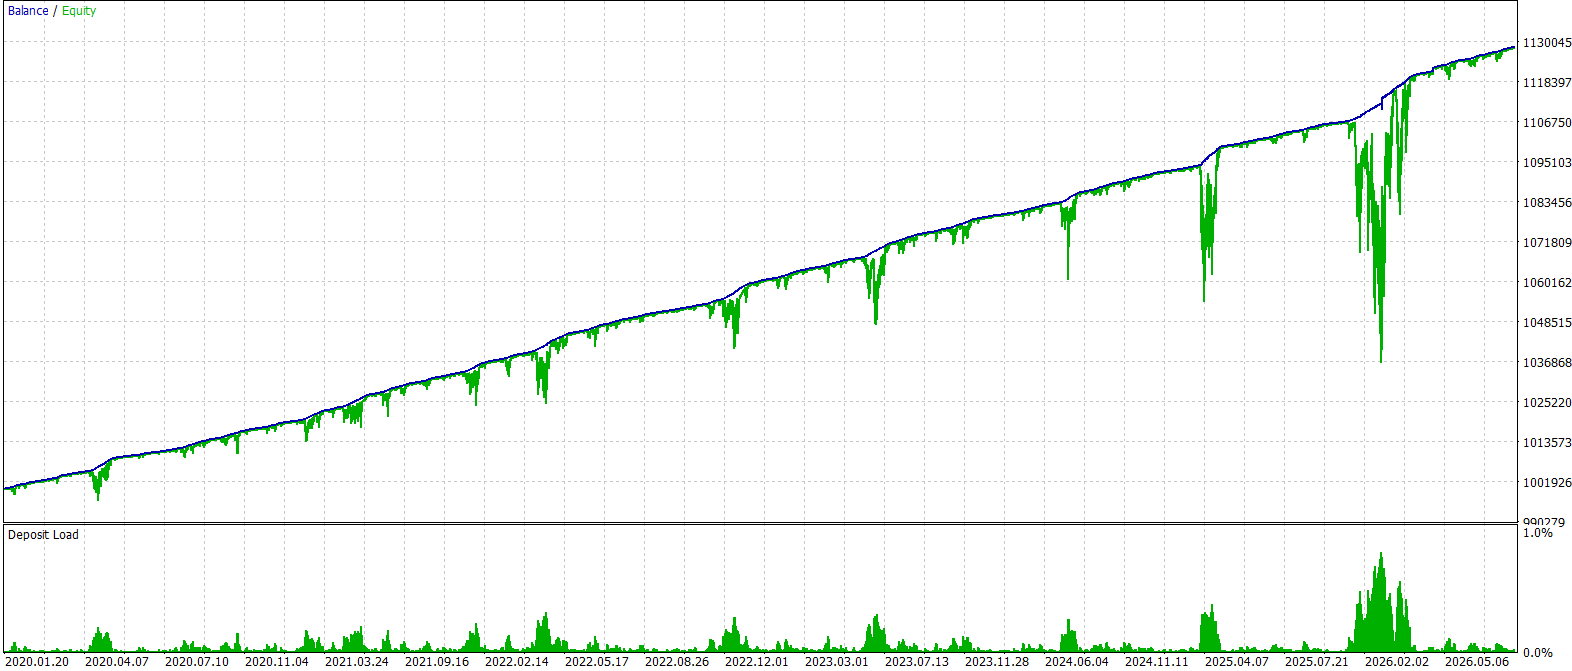
According to the back test (2020-2026), AUDCAD on M1 grew about 18% a year, roughly 1.5% a month, measured on the good (+50%) capital level.
Cent account (the tested figures divided by 100): total profit $1,285 against an equity drawdown of $700. Capital to start: minimum $875 (+25%), good $1,050 (+50%, recommended), best $1,400 (+100%). That is about $0.52 a day on average - a low-cost way to watch the EA work on your own broker.
Standard account (the tested figures as they are): total profit $128,514 against an equity drawdown of $69,981. Capital to start: minimum $87,476 (+25%), good $104,972 (+50%, recommended), best $139,962 (+100%). That is about $51.99 a day on average. Keep the buffer: the drawdown can come before the profit. Model: Every tick generated from complete 1-minute bars (the broker's real ticks start late for this pair).

USDCHF M1
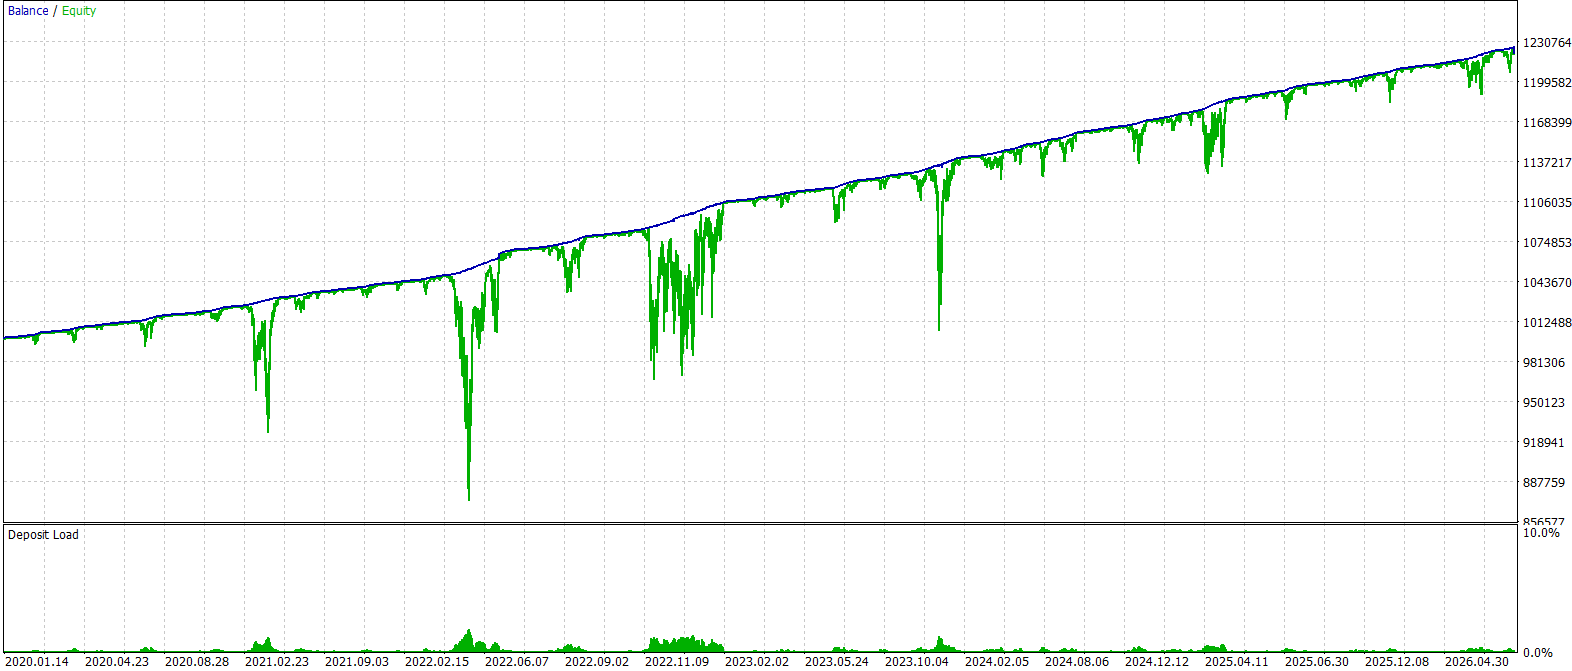
According to the back test (2020-2026), USDCHF on M1 grew about 12% a year, roughly 1.0% a month, measured on the good (+50%) capital level.
Cent account (the tested figures divided by 100): total profit $2,216 against an equity drawdown of $1,746. Capital to start: minimum $2,183 (+25%), good $2,619 (+50%, recommended), best $3,493 (+100%). That is about $0.90 a day on average - a low-cost way to watch the EA work on your own broker.
Standard account (the tested figures as they are): total profit $221,590 against an equity drawdown of $174,632. Capital to start: minimum $218,290 (+25%), good $261,948 (+50%, recommended), best $349,264 (+100%). That is about $89.64 a day on average. Keep the buffer: the drawdown can come before the profit.

EURUSD M1
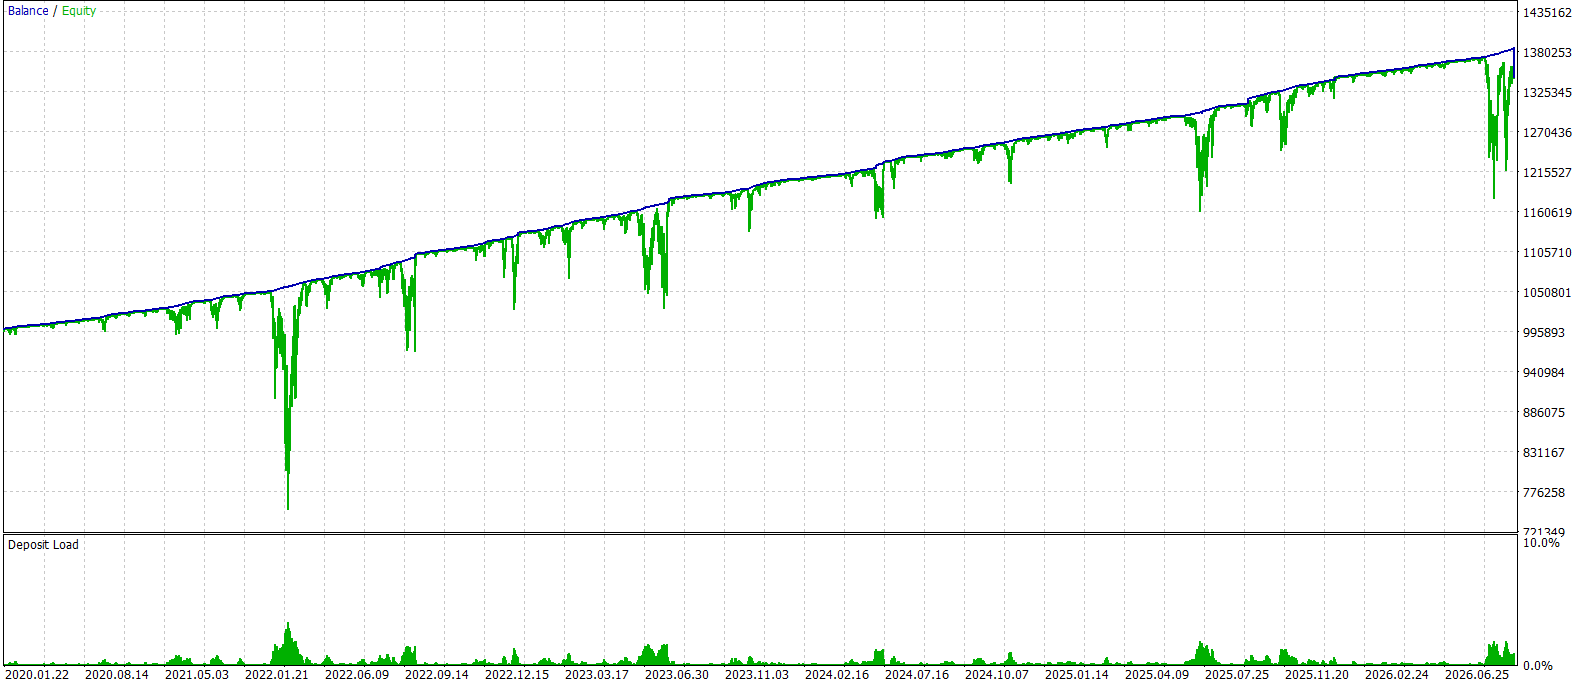
According to the back test (2020-2026), EURUSD on M1 grew about 12% a year, roughly 1.0% a month, measured on the good (+50%) capital level.
Cent account (the tested figures divided by 100): total profit $2,242 against an equity drawdown of $1,787. Capital to start: minimum $2,233 (+25%), good $2,680 (+50%, recommended), best $3,573 (+100%). That is about $0.91 a day on average - a low-cost way to watch the EA work on your own broker.
Standard account (the tested figures as they are): total profit $224,193 against an equity drawdown of $178,661. Capital to start: minimum $223,326 (+25%), good $267,992 (+50%, recommended), best $357,322 (+100%). That is about $90.69 a day on average. Keep the buffer: the drawdown can come before the profit.


CHFJPY M1
According to the back test (2020-2026), CHFJPY on M1 grew about 11% a year, roughly 1.0% a month, measured on the good (+50%) capital level.
Cent account (the tested figures divided by 100): total profit $3,456 against an equity drawdown of $2,984. Capital to start: minimum $3,730 (+25%), good $4,476 (+50%, recommended), best $5,968 (+100%). That is about $1.40 a day on average - a low-cost way to watch the EA work on your own broker.
Standard account (the tested figures as they are): total profit $345,587 against an equity drawdown of $298,408. Capital to start: minimum $373,010 (+25%), good $447,612 (+50%, recommended), best $596,816 (+100%). That is about $139.80 a day on average. Keep the buffer: the drawdown can come before the profit.

EURCHF M1
According to the back test (2020-2026), EURCHF on M1 grew about 11% a year, roughly 0.9% a month, measured on the good (+50%) capital level.
Cent account (the tested figures divided by 100): total profit $1,168 against an equity drawdown of $1,080. Capital to start: minimum $1,350 (+25%), good $1,620 (+50%, recommended), best $2,160 (+100%). That is about $0.47 a day on average - a low-cost way to watch the EA work on your own broker.
Standard account (the tested figures as they are): total profit $116,786 against an equity drawdown of $107,996. Capital to start: minimum $134,995 (+25%), good $161,994 (+50%, recommended), best $215,992 (+100%). That is about $47.24 a day on average. Keep the buffer: the drawdown can come before the profit.

AUDUSD M1
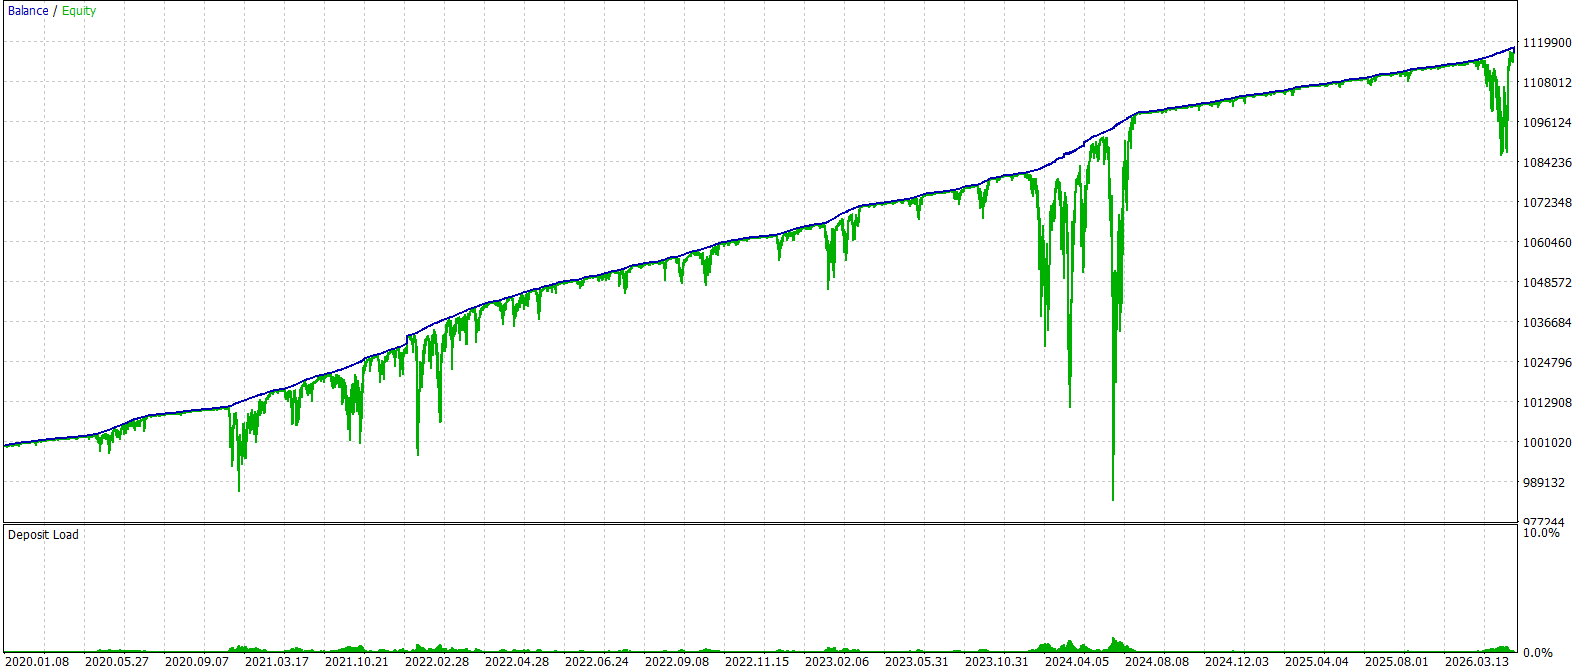
According to the back test (2020-2026), AUDUSD on M1 grew about 8.3% a year, roughly 0.7% a month, measured on the good (+50%) capital level.
Cent account (the tested figures divided by 100): total profit $1,964 against an equity drawdown of $2,337. Capital to start: minimum $2,921 (+25%), good $3,505 (+50%, recommended), best $4,674 (+100%). That is about $0.79 a day on average - a low-cost way to watch the EA work on your own broker.
Standard account (the tested figures as they are): total profit $196,426 against an equity drawdown of $233,694. Capital to start: minimum $292,117 (+25%), good $350,540 (+50%, recommended), best $467,387 (+100%). That is about $79.46 a day on average. Keep the buffer: the drawdown can come before the profit.


NZDUSD M1
According to the back test (2020-2026), NZDUSD on M1 grew about 7.4% a year, roughly 0.6% a month, measured on the good (+50%) capital level.
Cent account (the tested figures divided by 100): total profit $1,823 against an equity drawdown of $2,411. Capital to start: minimum $3,013 (+25%), good $3,616 (+50%, recommended), best $4,821 (+100%). That is about $0.74 a day on average - a low-cost way to watch the EA work on your own broker.
Standard account (the tested figures as they are): total profit $182,308 against an equity drawdown of $241,058. Capital to start: minimum $301,323 (+25%), good $361,588 (+50%, recommended), best $482,117 (+100%). That is about $73.75 a day on average. Keep the buffer: the drawdown can come before the profit.


EURJPY M1
According to the back test (2020-2026), EURJPY on M1 grew about 7.1% a year, roughly 0.6% a month, measured on the good (+50%) capital level.
Cent account (the tested figures divided by 100): total profit $3,120 against an equity drawdown of $4,305. Capital to start: minimum $5,382 (+25%), good $6,458 (+50%, recommended), best $8,611 (+100%). That is about $1.26 a day on average - a low-cost way to watch the EA work on your own broker.
Standard account (the tested figures as they are): total profit $312,020 against an equity drawdown of $430,527. Capital to start: minimum $538,158 (+25%), good $645,790 (+50%, recommended), best $861,053 (+100%). That is about $126.22 a day on average. Keep the buffer: the drawdown can come before the profit.

NZDCAD M1
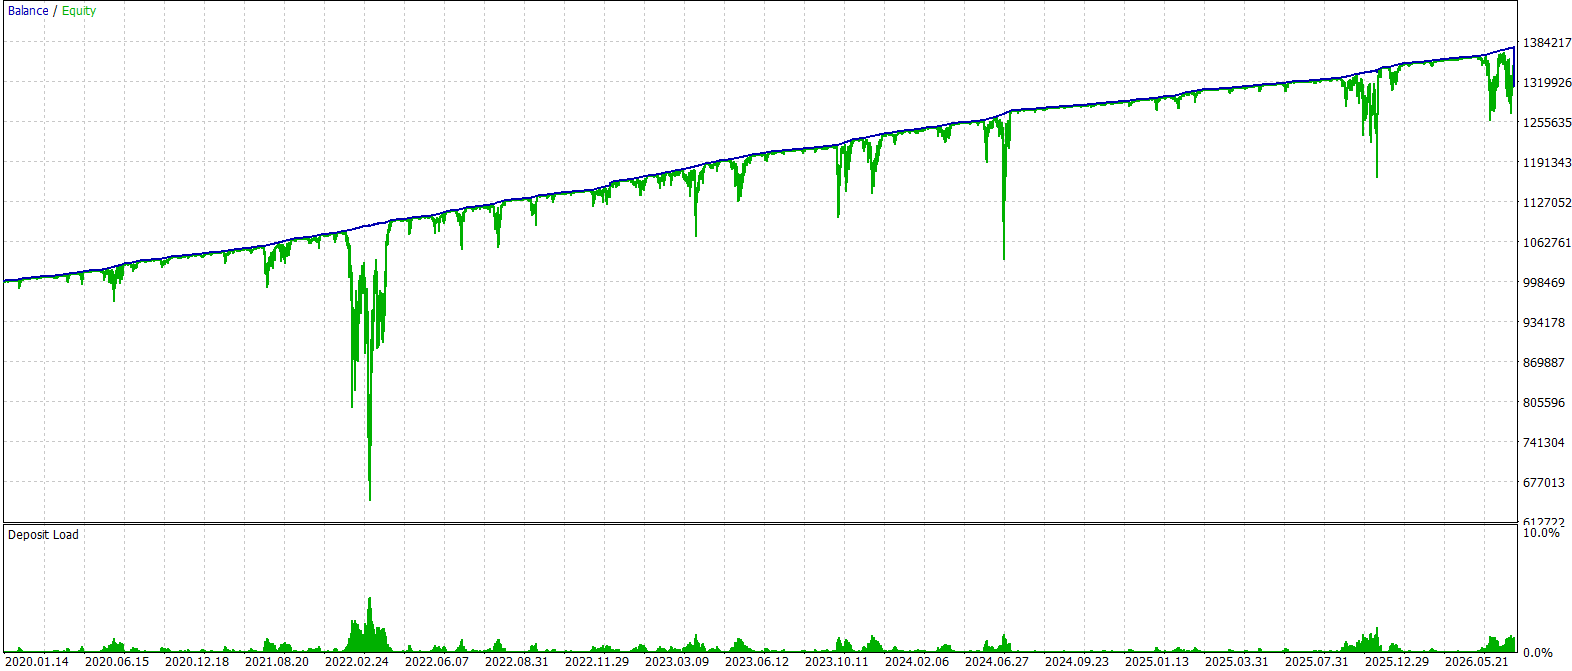
According to the back test (2020-2026), NZDCAD on M1 grew about 6.0% a year, roughly 0.5% a month, measured on the good (+50%) capital level.
Cent account (the tested figures divided by 100): total profit $1,383 against an equity drawdown of $2,263. Capital to start: minimum $2,829 (+25%), good $3,395 (+50%, recommended), best $4,527 (+100%). That is about $0.56 a day on average - a low-cost way to watch the EA work on your own broker.
Standard account (the tested figures as they are): total profit $138,348 against an equity drawdown of $226,336. Capital to start: minimum $282,920 (+25%), good $339,504 (+50%, recommended), best $452,671 (+100%). That is about $55.97 a day on average. Keep the buffer: the drawdown can come before the profit.

EURNZD M1
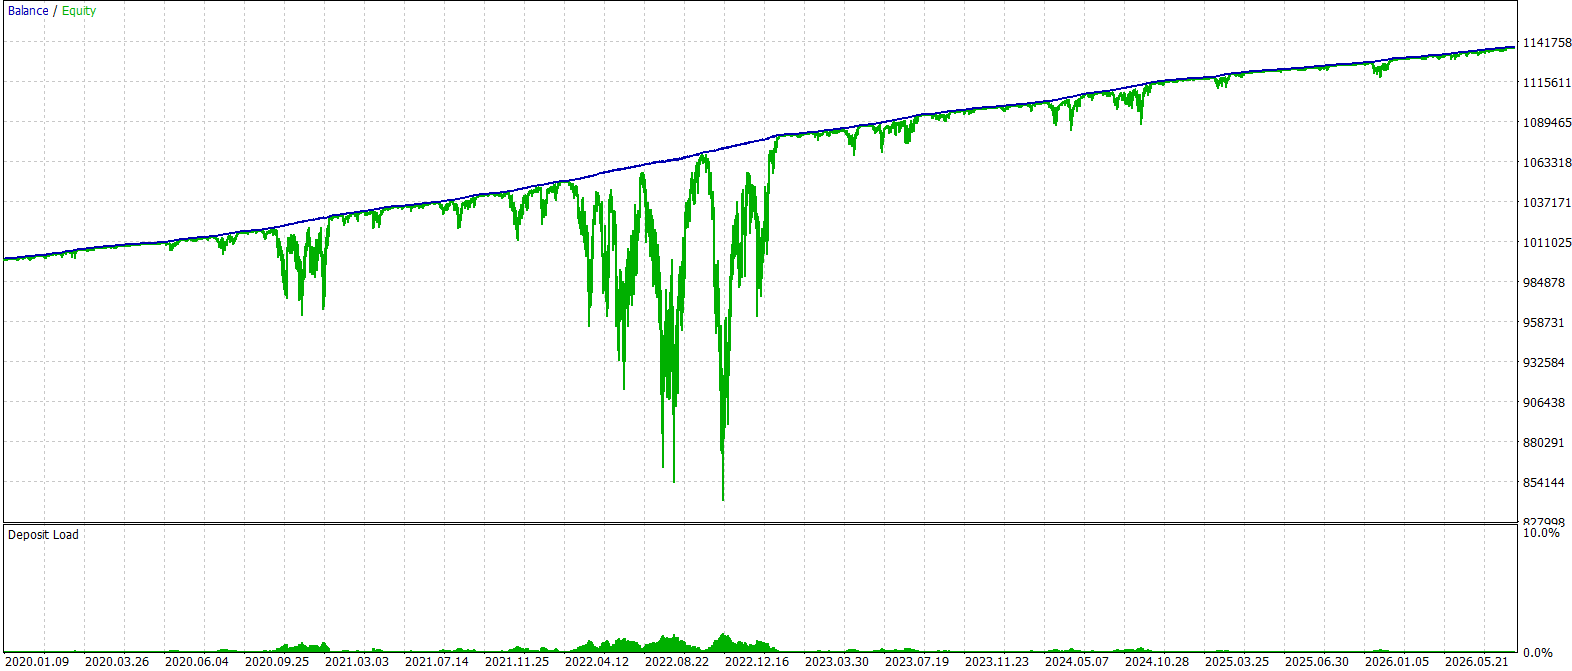
According to the back test (2020-2026), EURNZD on M1 grew about 5.5% a year, roughly 0.5% a month, measured on the good (+50%) capital level.
Cent account (the tested figures divided by 100): total profit $4,404 against an equity drawdown of $7,900. Capital to start: minimum $9,875 (+25%), good $11,850 (+50%, recommended), best $15,799 (+100%). That is about $1.78 a day on average - a low-cost way to watch the EA work on your own broker.
Standard account (the tested figures as they are): total profit $440,442 against an equity drawdown of $789,968. Capital to start: minimum $987,460 (+25%), good $1,184,951 (+50%, recommended), best $1,579,935 (+100%). That is about $178.17 a day on average. Keep the buffer: the drawdown can come before the profit.

GBPNZD M1
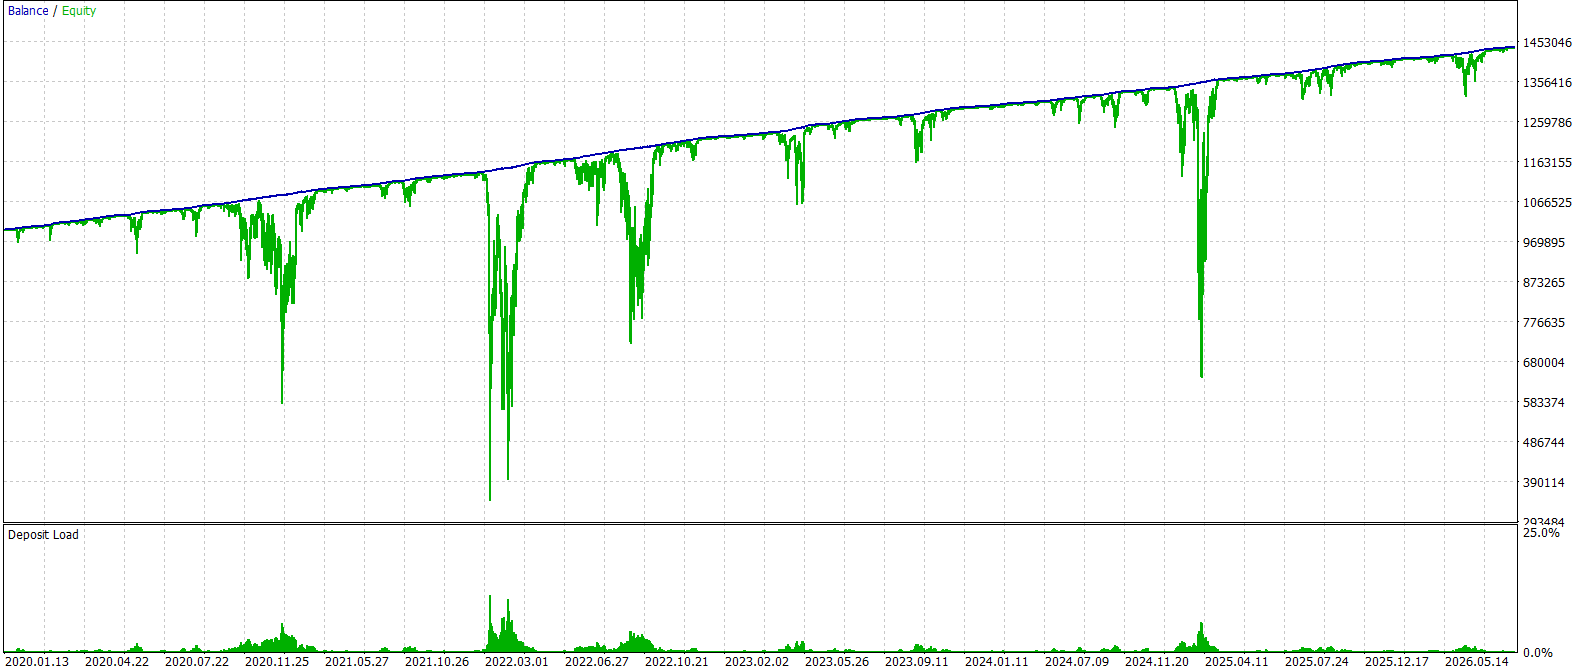
According to the back test (2020-2026), GBPNZD on M1 grew about 5.4% a year, roughly 0.5% a month, measured on the good (+50%) capital level.
Cent account (the tested figures divided by 100): total profit $4,627 against an equity drawdown of $8,380. Capital to start: minimum $10,474 (+25%), good $12,569 (+50%, recommended), best $16,759 (+100%). That is about $1.87 a day on average - a low-cost way to watch the EA work on your own broker.
Standard account (the tested figures as they are): total profit $462,725 against an equity drawdown of $837,958. Capital to start: minimum $1,047,448 (+25%), good $1,256,937 (+50%, recommended), best $1,675,917 (+100%). That is about $187.19 a day on average. Keep the buffer: the drawdown can come before the profit.


EURGBP M1
According to the back test (2020-2026), EURGBP on M1 grew about 5.2% a year, roughly 0.4% a month, measured on the good (+50%) capital level.
Cent account (the tested figures divided by 100): total profit $1,044 against an equity drawdown of $1,976. Capital to start: minimum $2,470 (+25%), good $2,964 (+50%, recommended), best $3,952 (+100%). That is about $0.42 a day on average - a low-cost way to watch the EA work on your own broker.
Standard account (the tested figures as they are): total profit $104,388 against an equity drawdown of $197,589. Capital to start: minimum $246,986 (+25%), good $296,384 (+50%, recommended), best $395,178 (+100%). That is about $42.23 a day on average. Keep the buffer: the drawdown can come before the profit.


CADCHF M1
According to the back test (2020-2026), CADCHF on M1 grew about 5.2% a year, roughly 0.4% a month, measured on the good (+50%) capital level.
Cent account (the tested figures divided by 100): total profit $1,194 against an equity drawdown of $2,273. Capital to start: minimum $2,841 (+25%), good $3,409 (+50%, recommended), best $4,546 (+100%). That is about $0.48 a day on average - a low-cost way to watch the EA work on your own broker.
Standard account (the tested figures as they are): total profit $119,418 against an equity drawdown of $227,293. Capital to start: minimum $284,117 (+25%), good $340,940 (+50%, recommended), best $454,587 (+100%). That is about $48.31 a day on average. Keep the buffer: the drawdown can come before the profit.

USDCAD M1
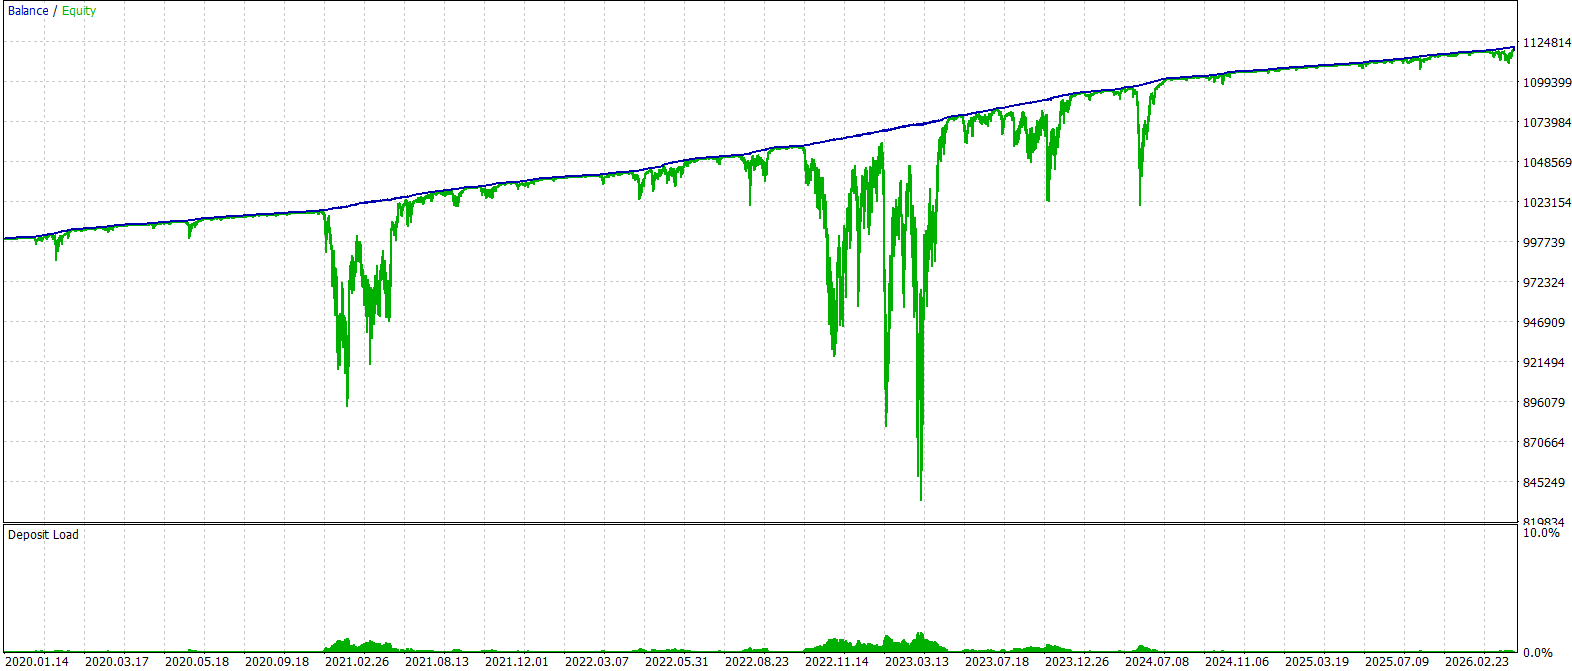
According to the back test (2020-2026), USDCAD on M1 grew about 5.2% a year, roughly 0.4% a month, measured on the good (+50%) capital level.
Cent account (the tested figures divided by 100): total profit $1,816 against an equity drawdown of $3,461. Capital to start: minimum $4,327 (+25%), good $5,192 (+50%, recommended), best $6,923 (+100%). That is about $0.73 a day on average - a low-cost way to watch the EA work on your own broker.
Standard account (the tested figures as they are): total profit $181,595 against an equity drawdown of $346,132. Capital to start: minimum $432,666 (+25%), good $519,199 (+50%, recommended), best $692,265 (+100%). That is about $73.46 a day on average. Keep the buffer: the drawdown can come before the profit.

GBPUSD M1
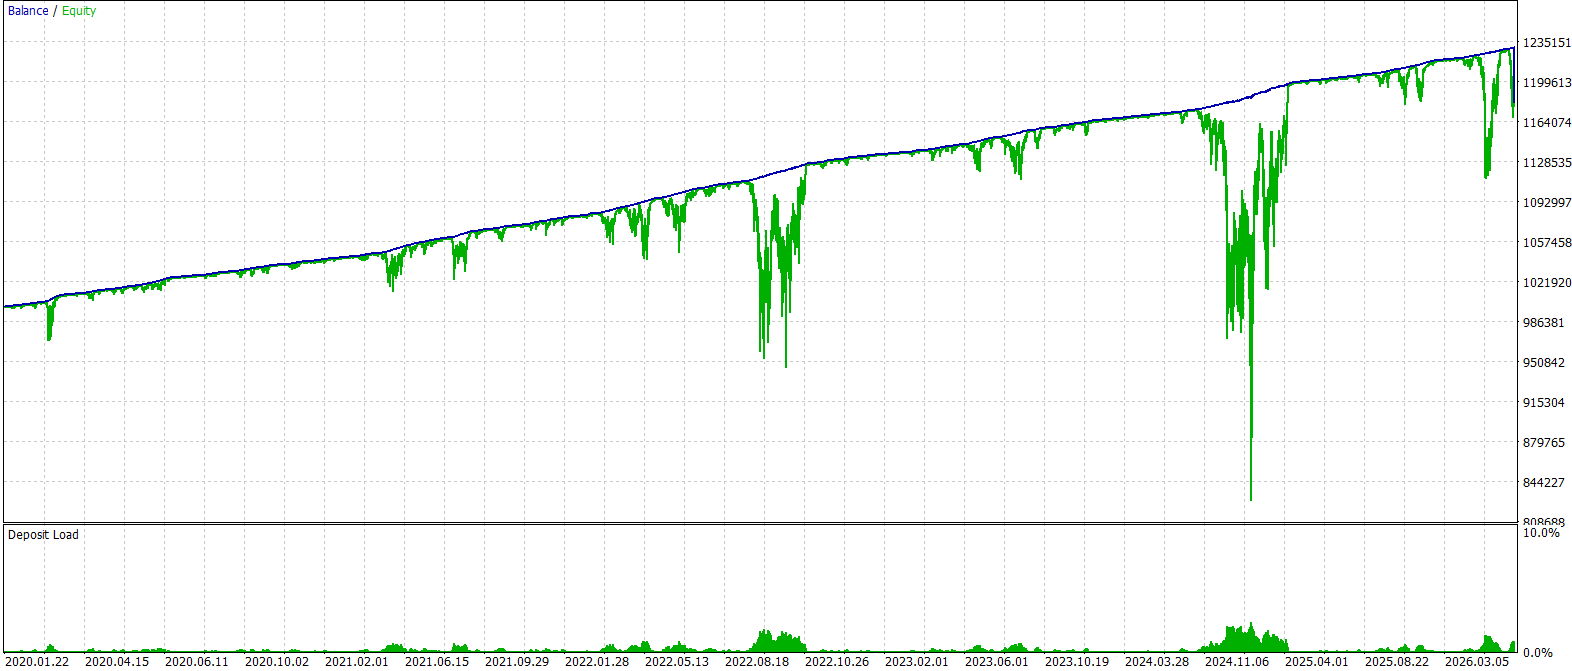
According to the back test (2020-2026), GBPUSD on M1 grew about 4.1% a year, roughly 0.3% a month, measured on the good (+50%) capital level.
Cent account (the tested figures divided by 100): total profit $3,407 against an equity drawdown of $8,145. Capital to start: minimum $10,181 (+25%), good $12,218 (+50%, recommended), best $16,290 (+100%). That is about $1.38 a day on average - a low-cost way to watch the EA work on your own broker.
Standard account (the tested figures as they are): total profit $340,698 against an equity drawdown of $814,502. Capital to start: minimum $1,018,127 (+25%), good $1,221,753 (+50%, recommended), best $1,629,004 (+100%). That is about $137.82 a day on average. Keep the buffer: the drawdown can come before the profit.


NZDCHF M1
According to the back test (2020-2026), NZDCHF on M1 grew about 4.0% a year, roughly 0.3% a month, measured on the good (+50%) capital level.
Cent account (the tested figures divided by 100): total profit $1,253 against an equity drawdown of $3,081. Capital to start: minimum $3,851 (+25%), good $4,621 (+50%, recommended), best $6,162 (+100%). That is about $0.51 a day on average - a low-cost way to watch the EA work on your own broker.
Standard account (the tested figures as they are): total profit $125,256 against an equity drawdown of $308,093. Capital to start: minimum $385,116 (+25%), good $462,139 (+50%, recommended), best $616,185 (+100%). That is about $50.67 a day on average. Keep the buffer: the drawdown can come before the profit.

GBPAUD M1
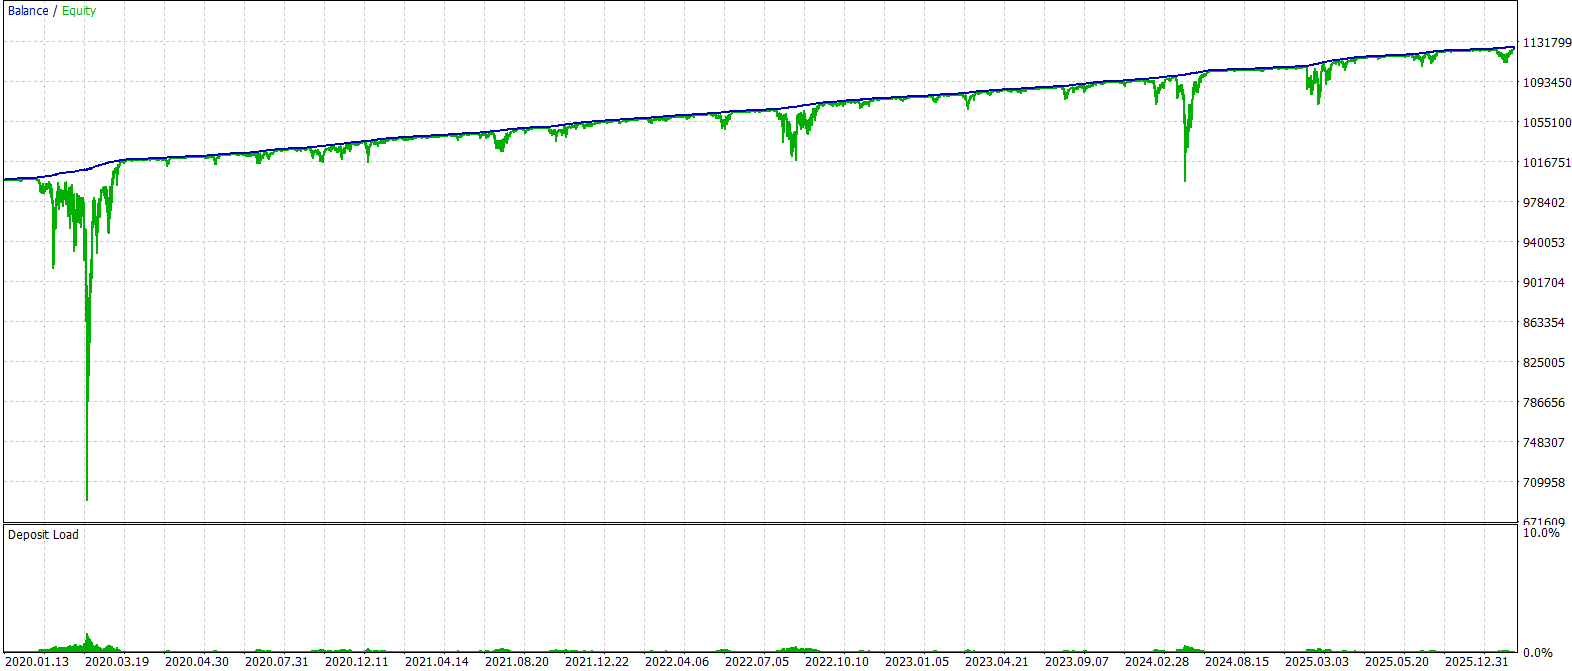
According to the back test (2020-2026), GBPAUD on M1 grew about 3.9% a year, roughly 0.3% a month, measured on the good (+50%) capital level.
Cent account (the tested figures divided by 100): total profit $4,766 against an equity drawdown of $12,171. Capital to start: minimum $15,213 (+25%), good $18,256 (+50%, recommended), best $24,341 (+100%). That is about $1.93 a day on average - a low-cost way to watch the EA work on your own broker.
Standard account (the tested figures as they are): total profit $476,617 against an equity drawdown of $1,217,069. Capital to start: minimum $1,521,337 (+25%), good $1,825,604 (+50%, recommended), best $2,434,138 (+100%). That is about $192.81 a day on average. Keep the buffer: the drawdown can come before the profit.


NZDJPY M1
According to the back test (2020-2026), NZDJPY on M1 grew about 3.8% a year, roughly 0.3% a month, measured on the good (+50%) capital level.
Cent account (the tested figures divided by 100): total profit $2,041 against an equity drawdown of $5,242. Capital to start: minimum $6,552 (+25%), good $7,863 (+50%, recommended), best $10,484 (+100%). That is about $0.83 a day on average - a low-cost way to watch the EA work on your own broker.
Standard account (the tested figures as they are): total profit $204,119 against an equity drawdown of $524,195. Capital to start: minimum $655,244 (+25%), good $786,293 (+50%, recommended), best $1,048,391 (+100%). That is about $82.57 a day on average. Keep the buffer: the drawdown can come before the profit.

EURCAD M1
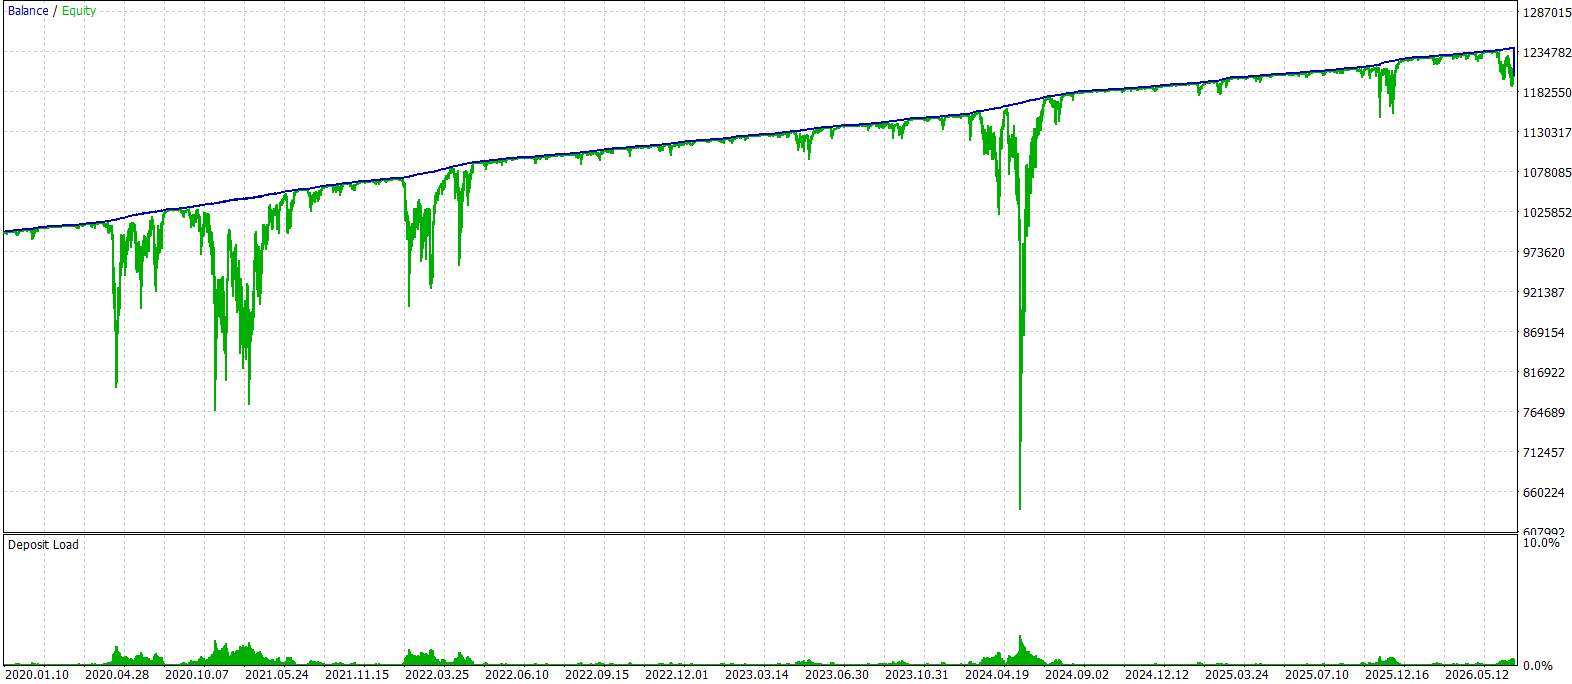
According to the back test (2020-2026), EURCAD on M1 grew about 3.4% a year, roughly 0.3% a month, measured on the good (+50%) capital level.
Cent account (the tested figures divided by 100): total profit $2,887 against an equity drawdown of $8,407. Capital to start: minimum $10,508 (+25%), good $12,610 (+50%, recommended), best $16,813 (+100%). That is about $1.17 a day on average - a low-cost way to watch the EA work on your own broker.
Standard account (the tested figures as they are): total profit $288,667 against an equity drawdown of $840,656. Capital to start: minimum $1,050,819 (+25%), good $1,260,983 (+50%, recommended), best $1,681,311 (+100%). That is about $116.77 a day on average. Keep the buffer: the drawdown can come before the profit. Model: Every tick generated from complete 1-minute bars (the broker's real ticks start late for this pair).

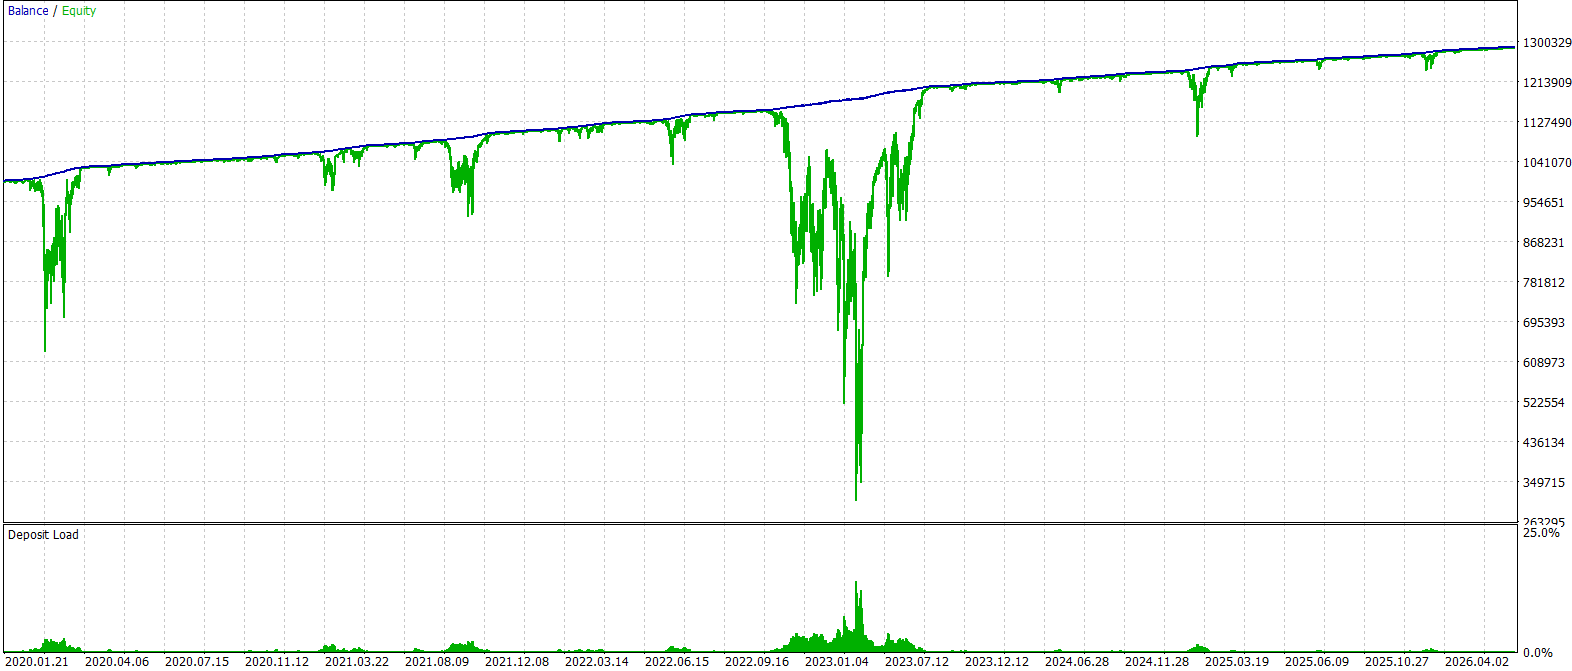
AUDCHF M1
According to the back test (2020-2026), AUDCHF on M1 grew about 3.0% a year, roughly 0.3% a month, measured on the good (+50%) capital level.
Cent account (the tested figures divided by 100): total profit $1,506 against an equity drawdown of $4,874. Capital to start: minimum $6,092 (+25%), good $7,311 (+50%, recommended), best $9,747 (+100%). That is about $0.61 a day on average - a low-cost way to watch the EA work on your own broker.
Standard account (the tested figures as they are): total profit $150,560 against an equity drawdown of $487,373. Capital to start: minimum $609,217 (+25%), good $731,060 (+50%, recommended), best $974,747 (+100%). That is about $60.91 a day on average. Keep the buffer: the drawdown can come before the profit.

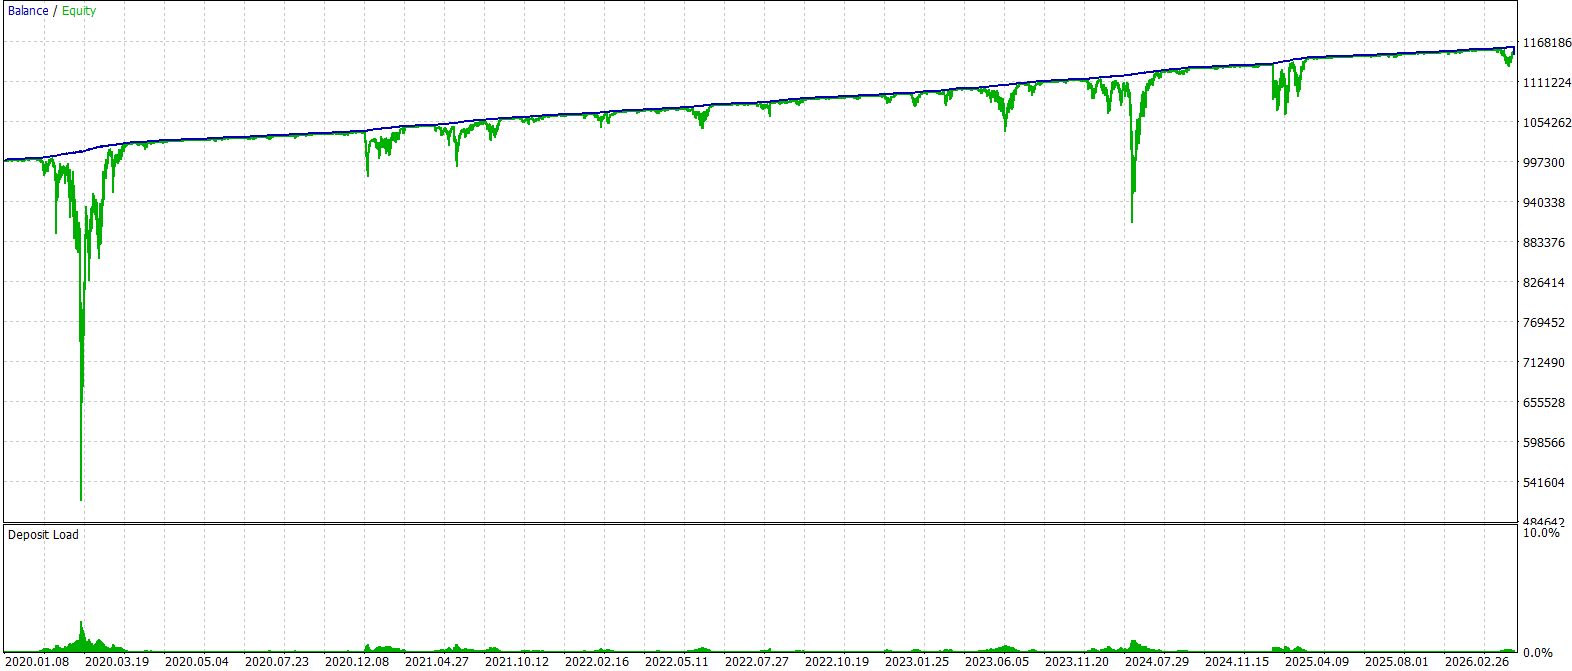
AUDJPY M1
According to the back test (2020-2026), AUDJPY on M1 grew about 2.9% a year, roughly 0.2% a month, measured on the good (+50%) capital level.
Cent account (the tested figures divided by 100): total profit $2,150 against an equity drawdown of $7,402. Capital to start: minimum $9,253 (+25%), good $11,103 (+50%, recommended), best $14,804 (+100%). That is about $0.87 a day on average - a low-cost way to watch the EA work on your own broker.
Standard account (the tested figures as they are): total profit $215,018 against an equity drawdown of $740,202. Capital to start: minimum $925,252 (+25%), good $1,110,303 (+50%, recommended), best $1,480,404 (+100%). That is about $86.98 a day on average. Keep the buffer: the drawdown can come before the profit. Model: Every tick generated from complete 1-minute bars (the broker's real ticks start late for this pair).

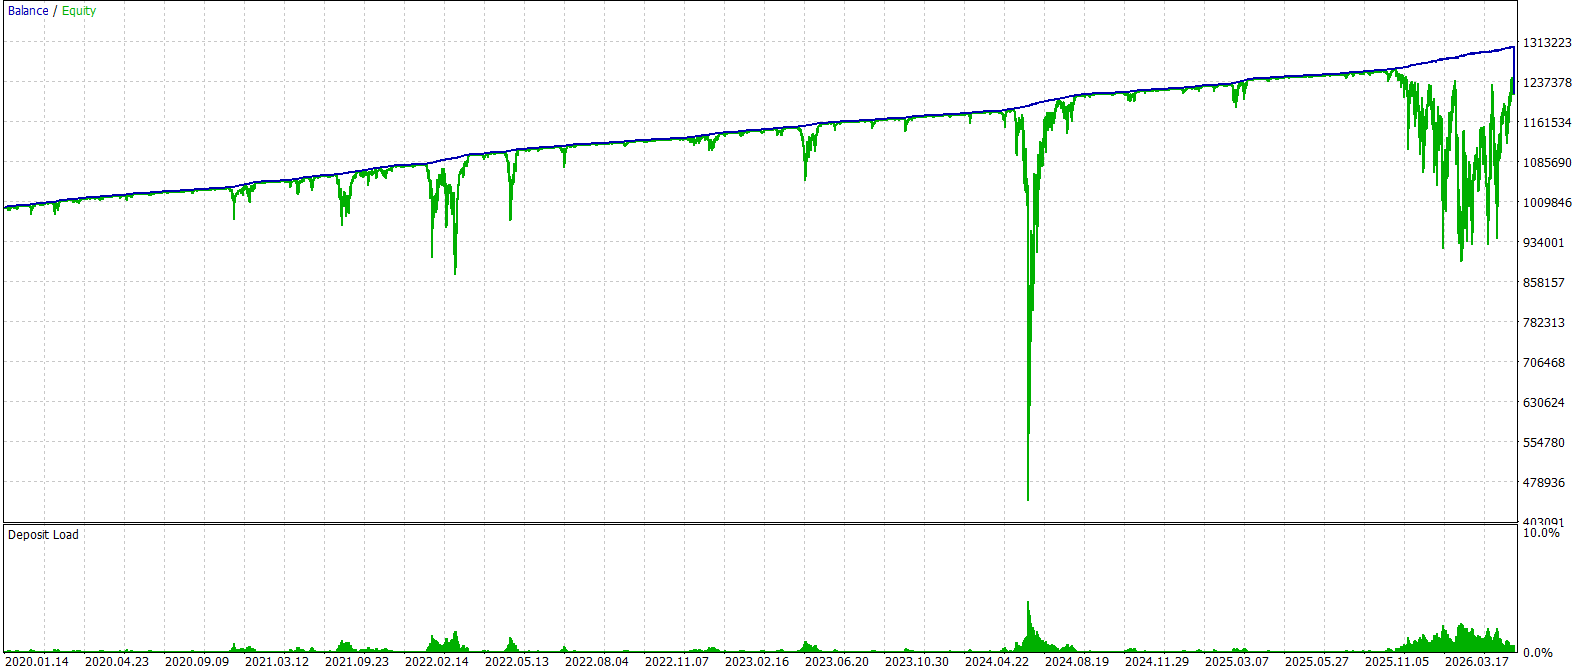
GBPCHF M1
According to the back test (2020-2026), GBPCHF on M1 grew about 2.2% a year, roughly 0.2% a month, measured on the good (+50%) capital level.
Cent account (the tested figures divided by 100): total profit $1,868 against an equity drawdown of $8,388. Capital to start: minimum $10,485 (+25%), good $12,583 (+50%, recommended), best $16,777 (+100%). That is about $0.76 a day on average - a low-cost way to watch the EA work on your own broker.
Standard account (the tested figures as they are): total profit $186,819 against an equity drawdown of $838,835. Capital to start: minimum $1,048,544 (+25%), good $1,258,252 (+50%, recommended), best $1,677,670 (+100%). That is about $75.57 a day on average. Keep the buffer: the drawdown can come before the profit.

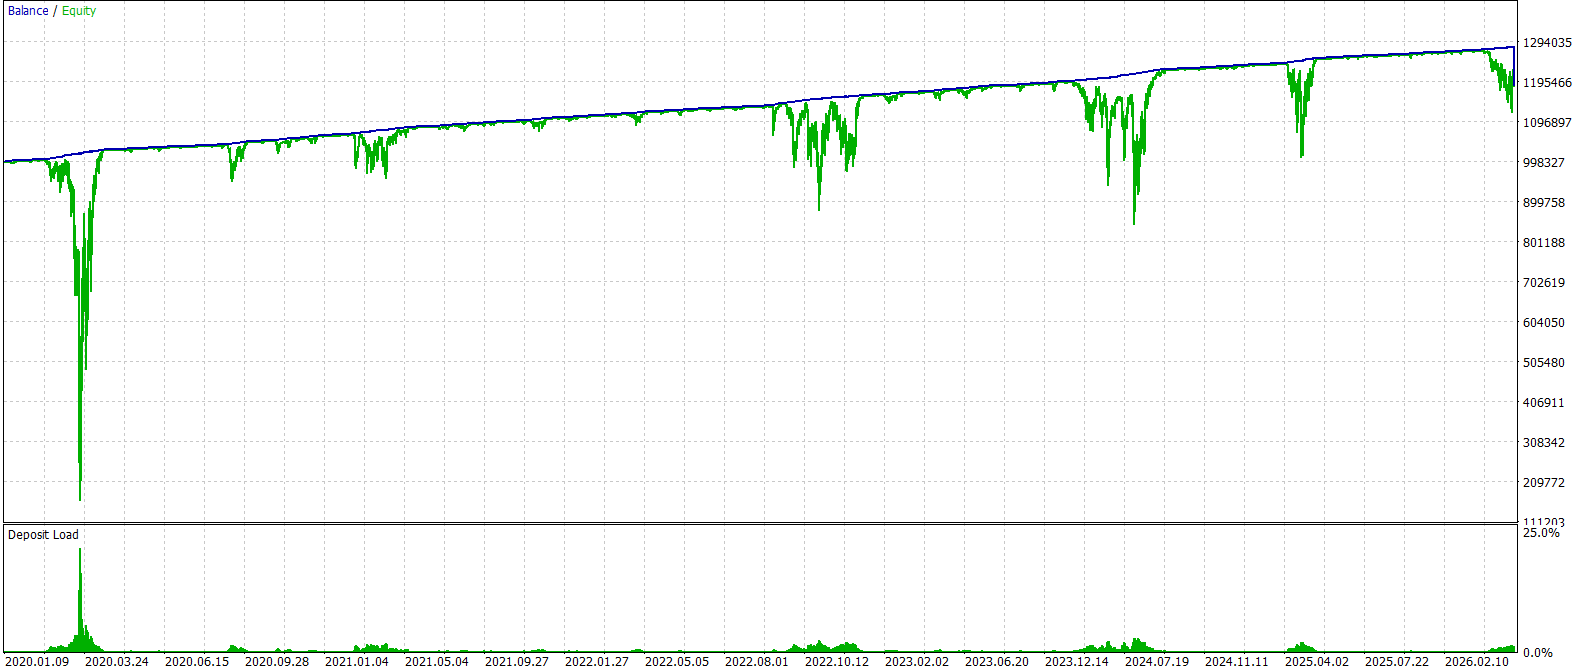
Not suited to the current settings (negative total profit in the back test, so left out; other settings may work): AUDNZD M1, CADJPY M1, EURAUD M1, GBPJPY M1, USDJPY M1.
Stack many pairs: the smart way to use a small account
"A cent account is not worth it" is only true for one pair. Run several different pairs side by side within the capital. Example: a $5,000 cent account with the best (+100%) buffer, one timeframe per pair: GBPCAD M1, AUDCAD M1. Capital used about $4,437, about $1.89 a day together, according to the back test. A standard account needs about 100x the capital for the same percentages. Pairs can draw down together, so the buffer is a must. Test Grid Core Fractal Adaptive Moving Average EA in your own Strategy Tester.
The other timeframes
Stable trading: H4 and H1 and Active trading: M30 and Active trading: M15 and Scalpers: M5. Start with Grid Core Fractal Adaptive Moving Average EA today.
Final disclaimer
All figures are according to the back test, on historical data, with the settings described above. Past results do not guarantee future results. Trading involves risk; grid systems can draw down deeply when price trends hard. Use the buffer, start small, and test on your own broker first.


