From plan to review: managing manual trades in one panel with Ziwox Trade Assistant

The work around a manual trade
A manual trade takes less than a second to send and much longer to do well. Before the click there is a lot size to work out from the risk, a stop and a target to place where the chart says they belong, a look at the news calendar and at what other traders are doing. After the click the trade needs care: a part closed at the first target, the stop moved to break-even, maybe a trailing stop, and a rule that stops the day when losses reach a limit. At the end of the week comes the question every trader should ask: which of these trades were good decisions, and why?
MetaTrader gives the building blocks for all of this, but they are spread over dialogs, the terminal window, a calculator and a spreadsheet. Ziwox Trade Assistant brings them into one panel that sits on the chart. This article walks through the panel the way a trade moves through it: plan, place, manage, protect, review.
Download and Purchase: MQL4 | MQL5
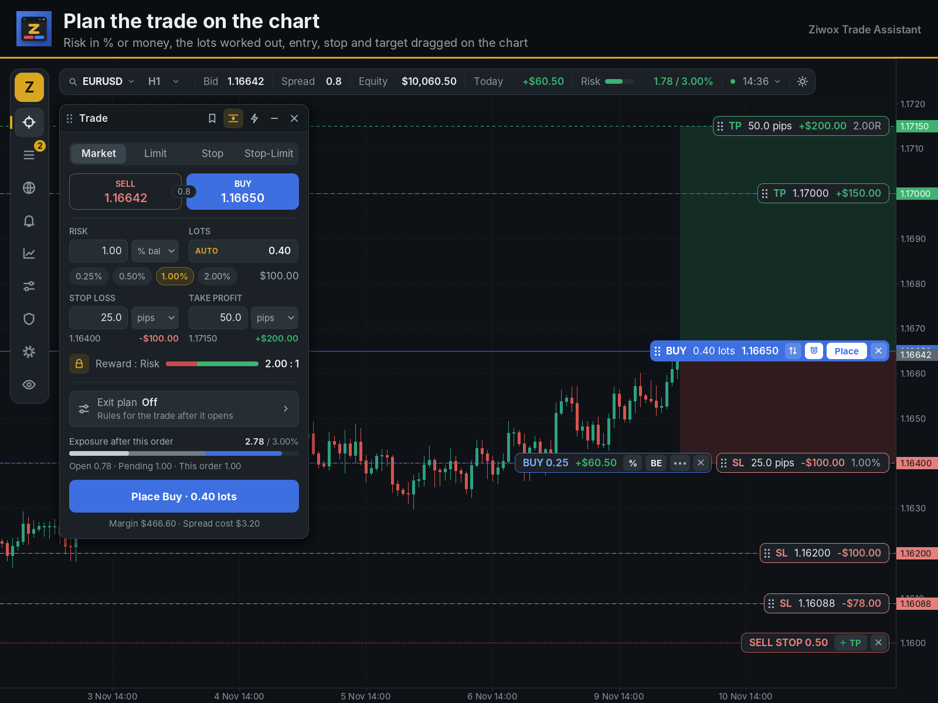
The Trade window and the planned order on the chart
1. Start from the risk
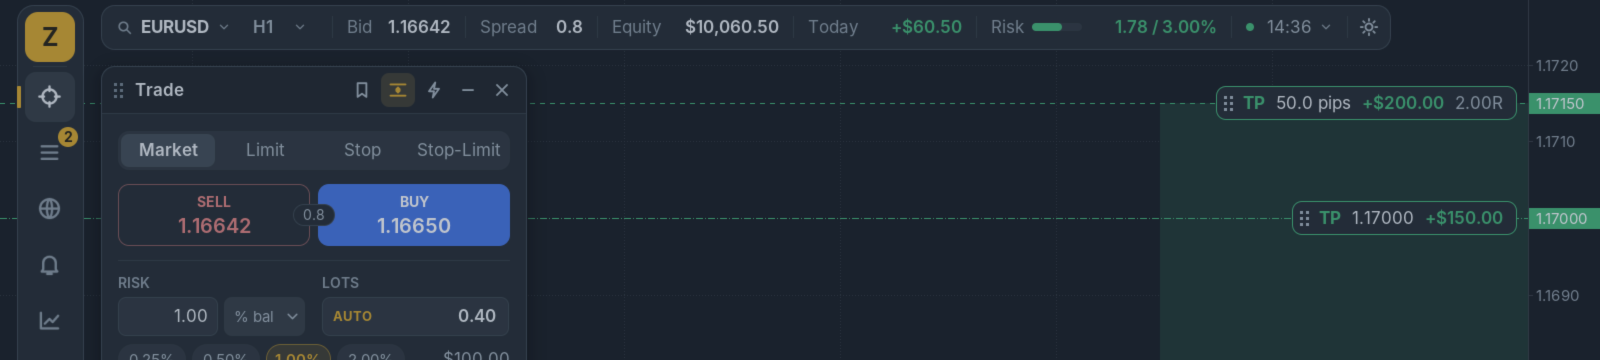
The Trade window asks first how much you are willing to lose, not how many lots you want. The risk can be a percent of the balance, of the equity or of the free margin, a fixed amount of money, or plain lots for those who prefer them. Four buttons under the risk box hold your usual values, for example 0.25 %, 0.5 %, 1 % and 2 %.
Set the stop loss in pips or as a price, and the panel works out the lots. The lot size is rounded down to the lot step of the symbol, so the loss at the stop does not go above the amount you set (slippage and gaps aside). If you prefer the nearest step, one setting changes that. When the risk buys less than the smallest lot of the symbol, the order is blocked by default and a message tells you what the smallest lot would risk; a setting can use the smallest lot instead.
Under the order sits the exposure meter. It adds the risk of open trades, the risk of pending orders and the risk of this order, and compares the total with your exposure limit. The margin and the spread cost are shown before you send.
2. Draw the trade where the chart says it belongs
With the lines switched on, the planned order is drawn on the chart: entry, stop loss and take profit, with a green and a red zone between them. Drag the stop line below the last swing low and the lots change at once; with the reward-to-risk lock on, the target follows to keep the ratio. Drag the entry line away from the price and the order becomes a Limit or a Stop order. A magnet snaps a dragged line to candle and swing highs and lows, and a stop line lands a few pips beyond the level. Hold Ctrl to move a line freely.
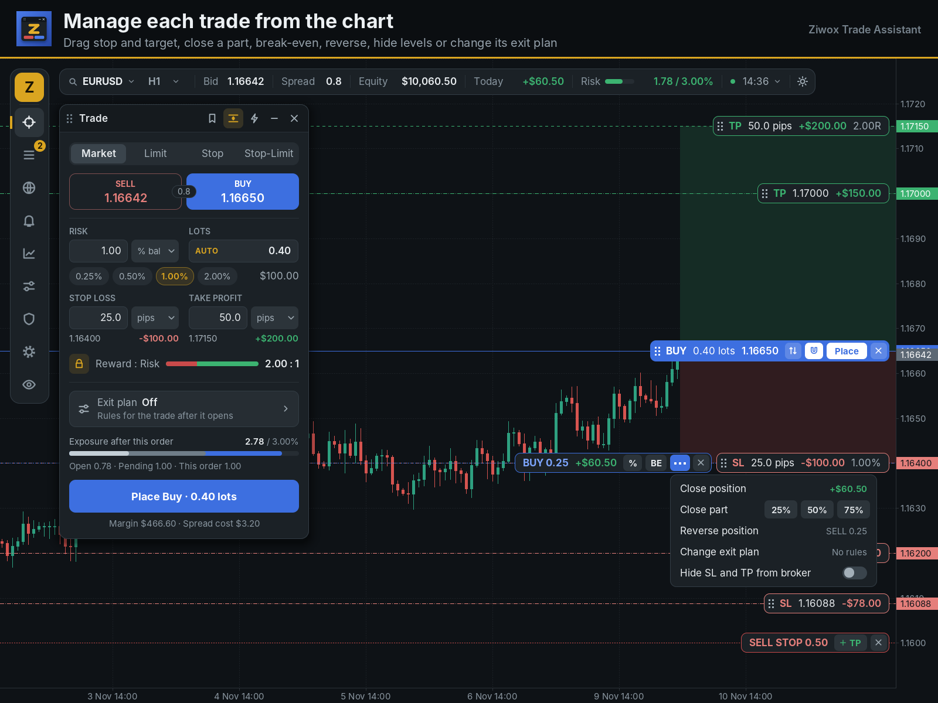
Each open trade has a label with its own buttons
Once a trade is open, its label on the chart becomes its control panel: close 25, 50 or 75 percent, move the stop to break-even, close, reverse, hide the stop and target from the broker, or change the exit plan of this one trade. Labels can show money, distance, R, or all of them. A trade that has no stop gets one by dragging "+ SL" out of its label.
3. Decide the exit before the entry
Most trading plans are clear about the entry and vague about the exit. The Exit plan window turns the exit into rules that run on their own while MetaTrader is open:
• Take profit in parts: up to three levels in R (multiples of the initial risk), each with the share of the volume it closes. A separate order for each level is also possible.
• Stop loss in parts: reduce a losing trade before the full stop is reached.
• Break-even: at a chosen profit in R the stop moves to the entry plus a few pips.
• Trailing stop: seven methods (fixed distance, ATR, moving average, fractals, Parabolic SAR, bar highs and lows, and take profit steps), starting at a chosen profit in R.
• Time exit: close a trade after a set time.
• Hidden stop and target: the broker does not see them; a wider safety stop stays at the broker in case the terminal is closed.
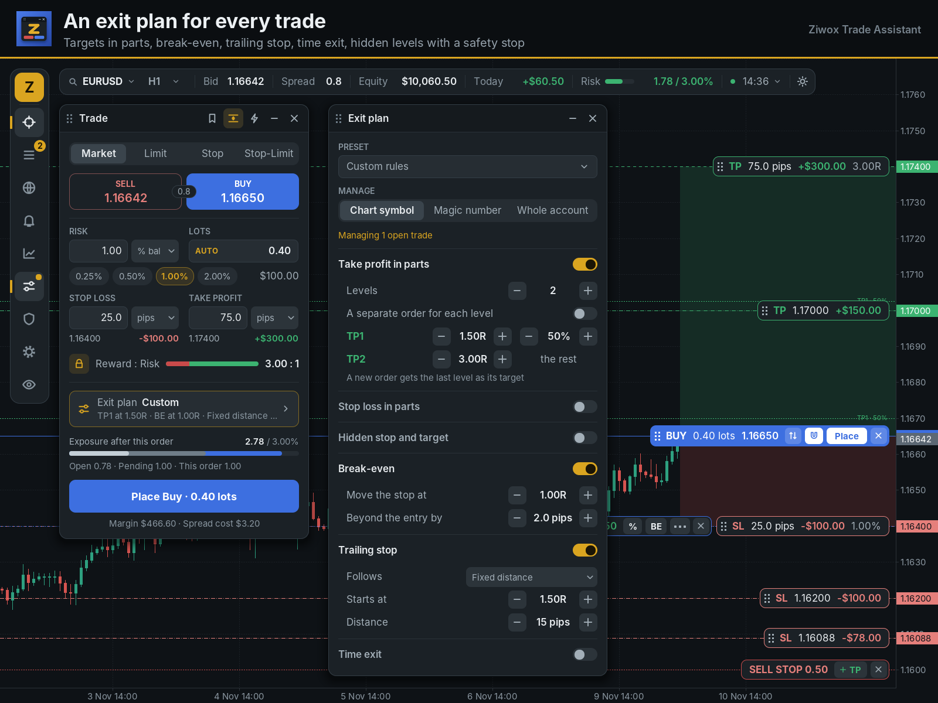
An exit plan with two targets and a break-even rule
A plan can manage the trades of the chart symbol, the trades of one Expert ID, or the whole account, so trades opened from the MetaTrader one-click panel or from a phone are managed too. A single trade can follow a plan of its own. The levels still ahead are drawn on the chart as dotted lines named, for example, "TP1 · 50%".
4. See every trade in one place
The Positions window lists open trades, pending orders and the history of closed trades. Filters by symbol and by Expert ID apply to everything in the window, including the floating result and the group close menu. A small bar shows where the price is between the stop and the target of each trade, and the result is given in money and in R. Click a row to edit its stop and target in place, close a part, move to break-even, reverse, or hide its levels.
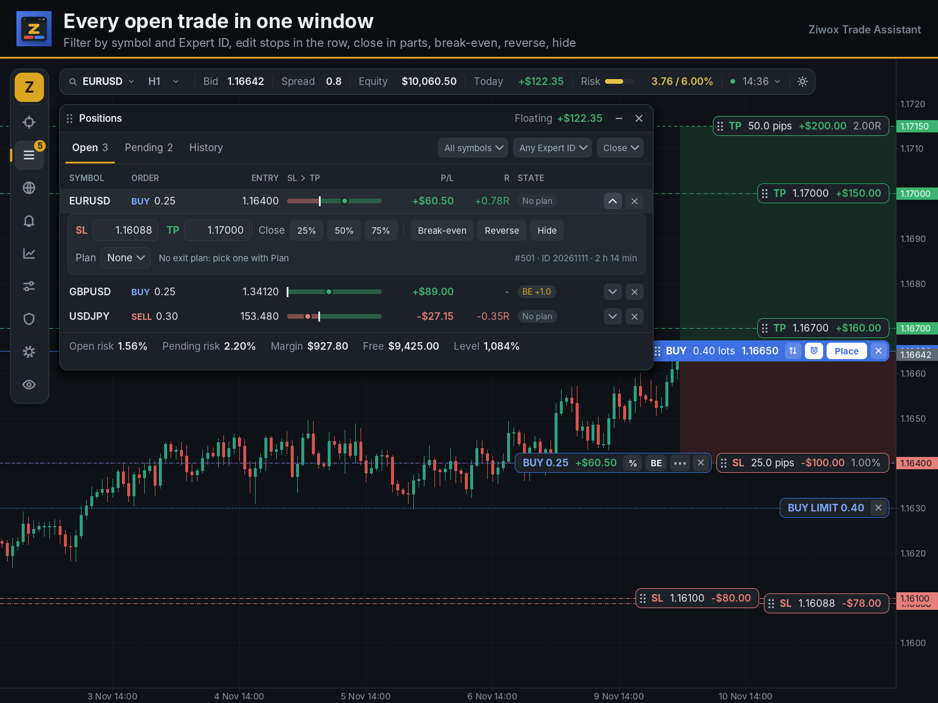
The Positions window with one trade opened for editing
Closing all trades at once is a press held for 1.2 seconds. This short delay guards against a costly kind of mistake: a click in the wrong place.
5. Protect the account from a bad day
Discipline is easier when the rules are enforced by software. The Protect window holds rules for the whole account: a daily loss limit as a percent of the balance the day started with, a maximum number of trades per day, and what happens at the limit (block new orders, or block and close everything). Positions can also be closed at a floating profit, a floating loss, or a time of day, for example every Friday at 21:00 server time.
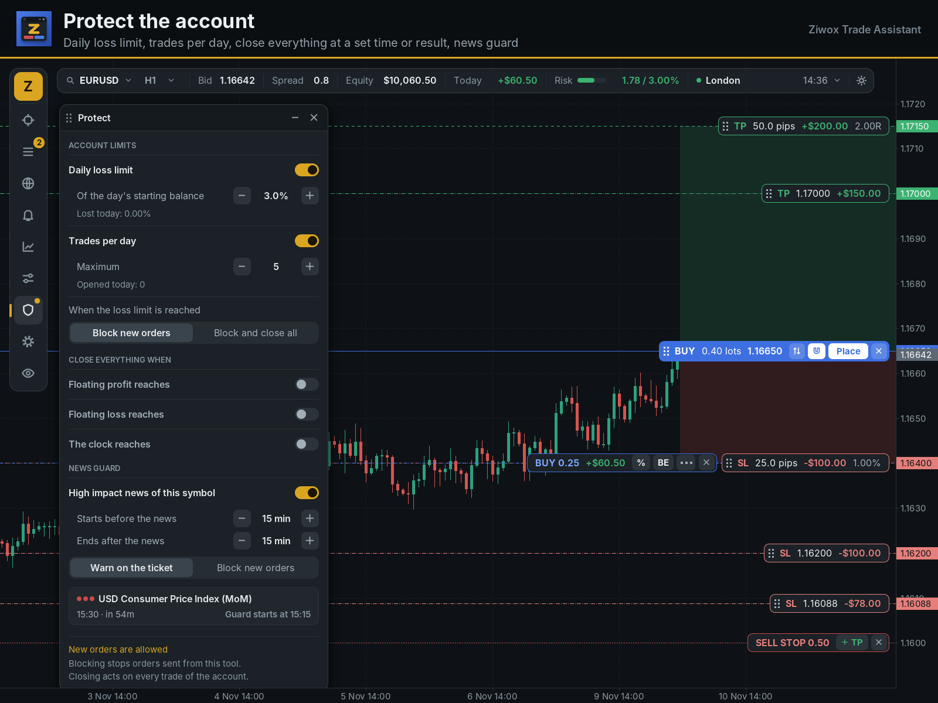
Protect: daily limits and the news guard
The news guard looks at the economic calendar of the two currencies of the symbol. From a number of minutes before to a number of minutes after a high impact event, it either warns on the ticket or blocks new orders from the panel. Protect blocks orders sent from the panel; it cannot block other programs, so it is a tool for your own discipline, not a lock on the account.
6. Let the chart call you
Alerts cover four groups. Price alerts fire when the price crosses a level, when a bar closes beyond it, or when the price comes within a distance. Trade alerts watch results in R, money or pips, closed trades, filled orders, a wide spread, or news ahead. Ziwox alerts follow the pair bias, the retail crowd, new COT reports and currency strength. Account alerts watch the daily drawdown, the Protect limits, the margin level and the floating result.
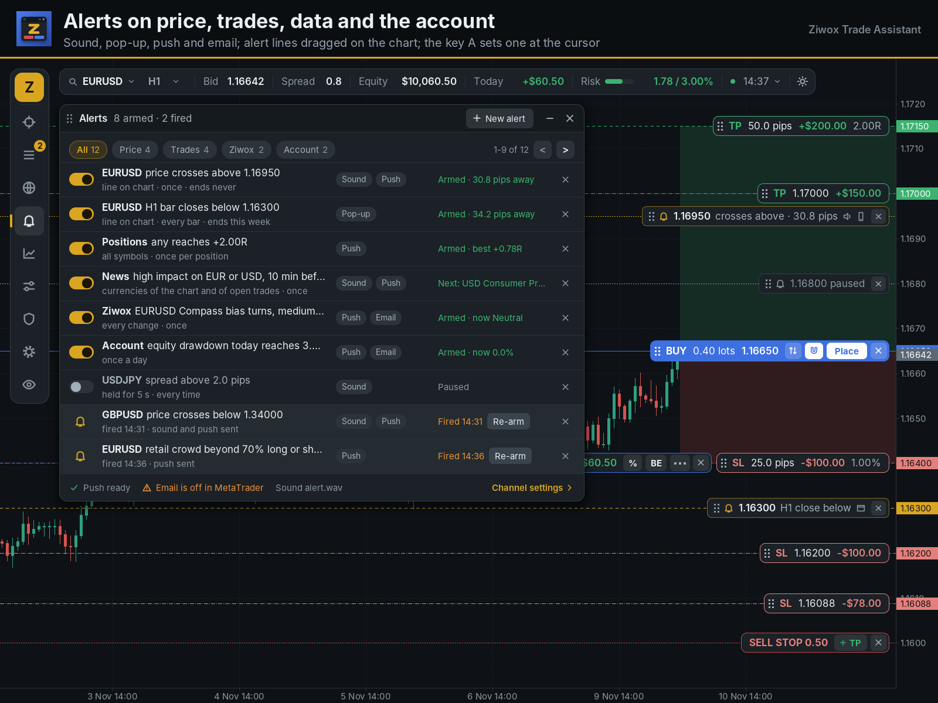
The Alerts window and two alert lines on the chart
Each alert goes out by sound, pop-up, push notification to the phone, or email. Price alerts of the chart symbol are lines you can drag; press A with the mouse over the chart to set one at the cursor. One chart of the terminal checks and sends all alerts, so each alert arrives once even when the panel runs on many charts.
7. Review: the journal
A trade is not finished when it closes. The Journal reads the account history of the terminal, so trades from before the panel was installed count too. The Summary shows the net result of a period, the win rate, the average trade, the profit factor, the balance curve and the result of each trade in R.
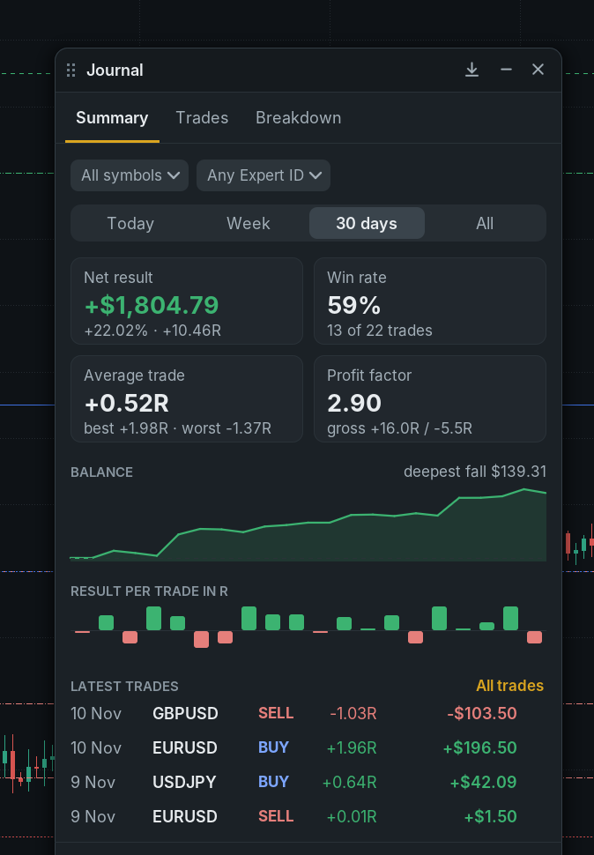
The Journal summary of the last 30 days
Every closed trade also has a page of its own. The panel draws the trade on a small chart from the price history: entry, stop, target, every partial exit, and the points where the trade was most in profit and most in loss (the maximum favourable and adverse excursion, MFE and MAE). These two numbers answer useful questions: was the stop too close, was the target realistic, did the trade give back a profit it once had?
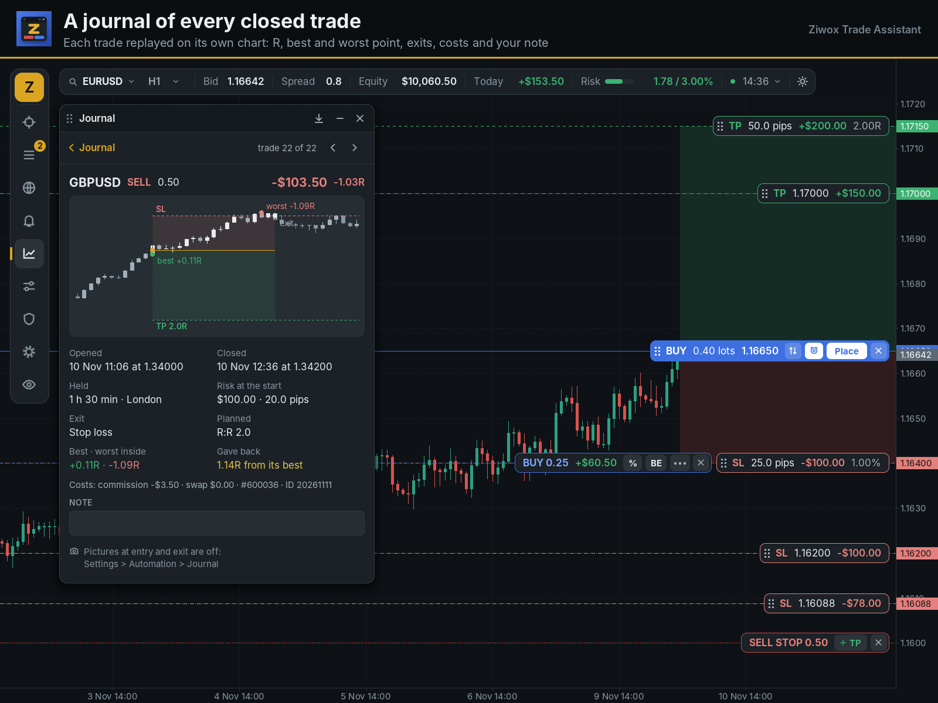
One trade replayed: a stop loss after the trade went 0.11R in profit
The Breakdown tab groups the results by symbol, direction, session, holding time and type of exit. A note can be added to each trade, and everything exports to CSV, with a comma or with a semicolon for spreadsheets set to a language that uses a decimal comma.
8. Context from Ziwox data
Ziwox Trade Assistant includes data from Ziwox, a provider of fundamental and positioning data for traders. The Fundamentals window starts compact, with the bias of the pair, the COT position, the retail crowd and the next news. The full view opens seven pages:
• Overview: the pair bias from -100 to +100 and the five families of signals behind it (fundamental, COT, retail, price trend, seasonal), currency strength, the COT net position, retail sentiment, the calendar and a short analysis note written from the numbers.
• COT positioning: non-commercial traders, leveraged funds and asset managers, with 52 weeks of history and the COT index.
• Retail sentiment, Calendar and Currency strength with central banks.
• Seasonality: the usual path of the year and of the month, from the daily bars of your broker.
• Analysis: 18 signals on three horizons.
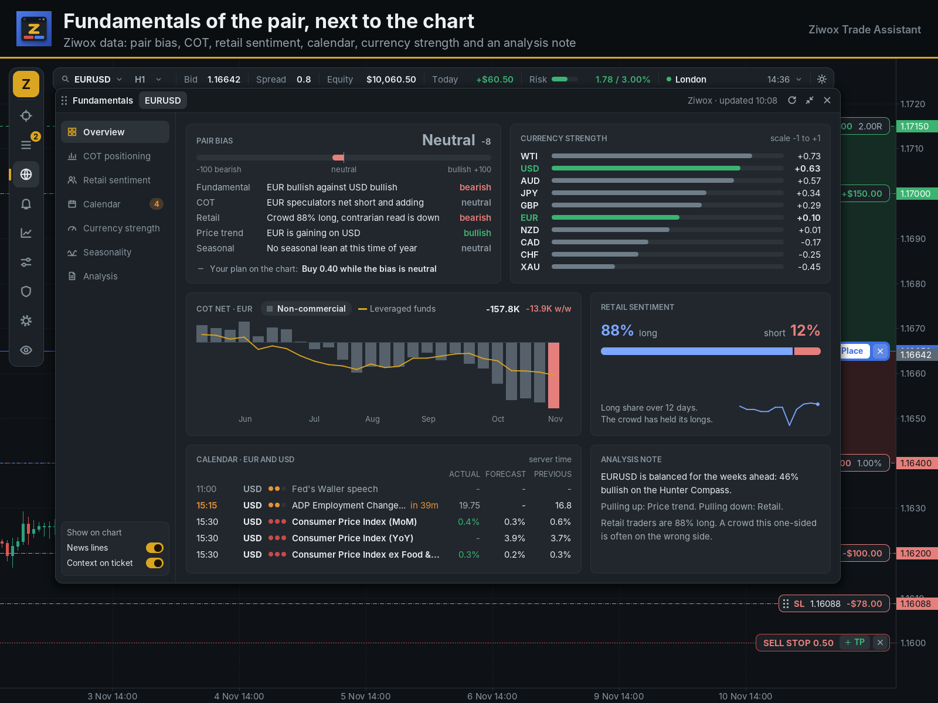
The Overview page of the full Fundamentals view
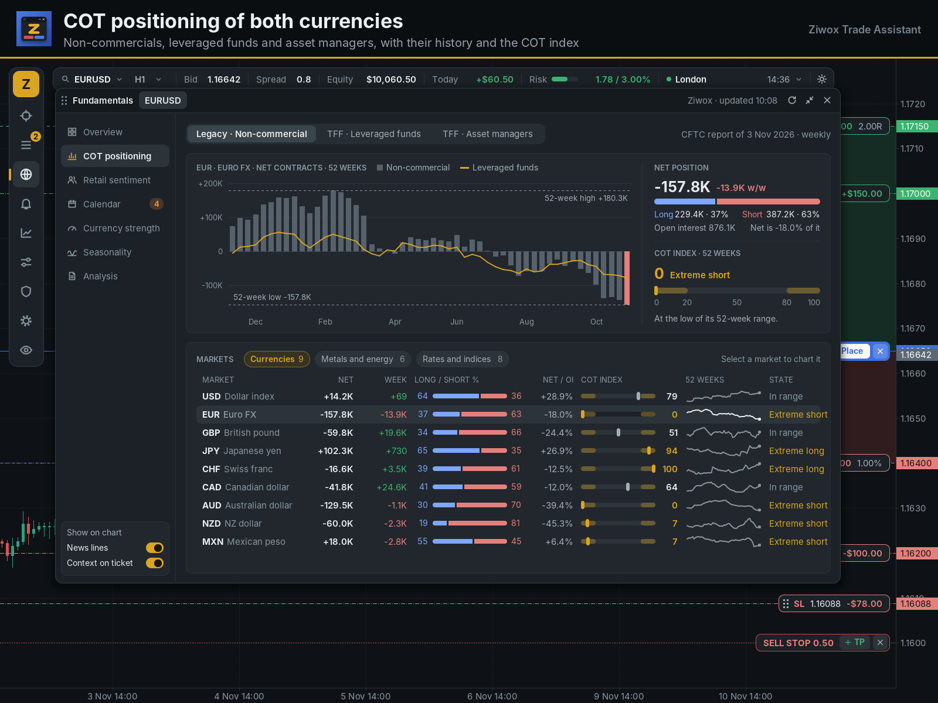
COT positioning of the euro and of the other markets
The same data appears where it is needed: a one-line summary on the order ticket ("1 of 5 support BUY"), and high impact news as vertical lines on the chart. Seasonality is computed in the terminal from your broker's daily bars, so it works for every symbol.
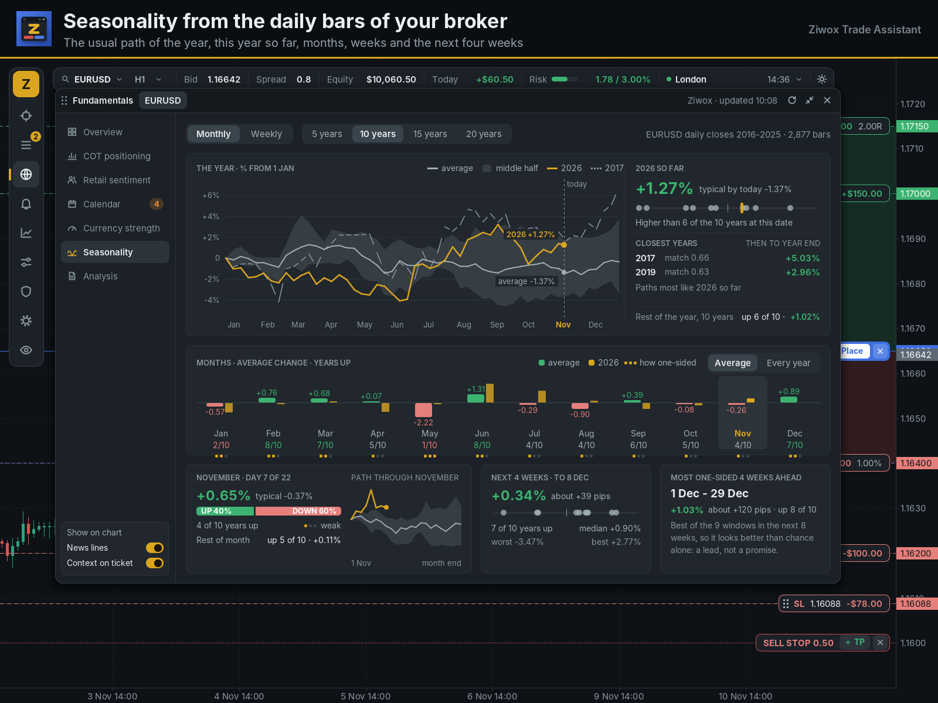
Seasonality of EURUSD over ten years
9. One profile for each symbol
Many traders scalp one market and hold swing trades in another. Version 2.00 keeps one set of settings, a profile, for each symbol: quick risk values, sounds, expiry of pending orders, label units, colours and more. All charts of a symbol share its profile; a symbol without its own uses Default. Every setting sits in one tree with a search box, each page has a "Reset this page" button, and all profiles can be saved to one backup file.
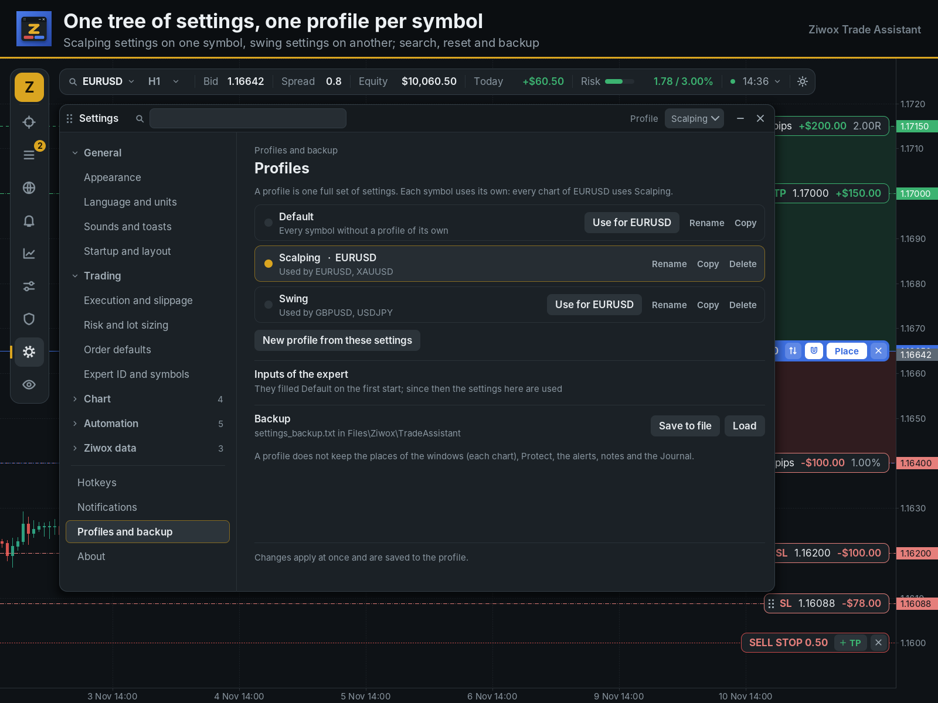
Profiles: Scalping for EURUSD and XAUUSD, Swing for GBPUSD and USDJPY
The interface follows the chart: dark, light, or matching the chart background, with five accent colours and a size from 70 to 250 percent for high-resolution screens.
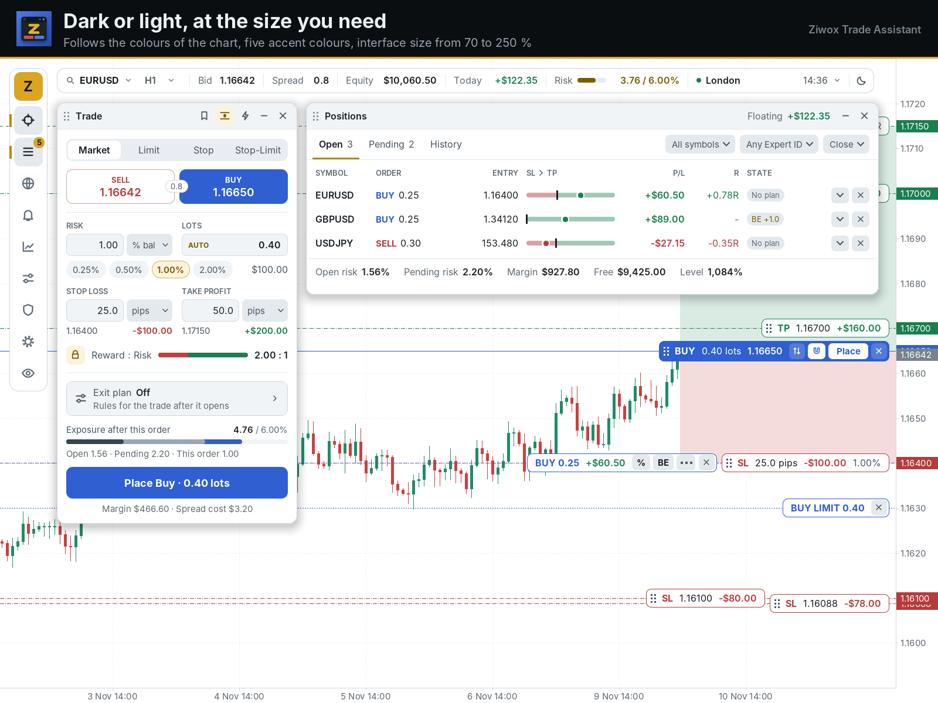
The light theme on a light chart
A day with the panel
Here is how the pieces fit together in a normal trading day:
• In the morning, open the Fundamentals window of the pairs you follow. Note the bias, the crowd and the news of the day. Protect's news guard is set to warn 15 minutes before and after high impact news.
• Set a daily loss limit of 3 % and a maximum of five trades. These rules apply to every chart of the account.
• When a setup appears, pick the risk with one click, drag the stop beyond the swing, check the exposure meter, and place the order.
• The exit plan takes half at 1.5R and moves the stop to break-even at 1R. You can leave the chart; a push message tells you when something happens.
• At the end of the week, open the Journal. Look at the trades where the MFE was large but the result was a loss. They are the best teachers you have.
Technical notes
• Versions for MetaTrader 4 and MetaTrader 5 with the same interface. Stop-Limit orders and netting accounts are supported in MetaTrader 5.
• No DLL. Ziwox data is downloaded with WebRequest from the timer only, cached once for all charts, and needs https://ziwox.com in the list of allowed URLs (Tools > Options > Expert Advisors).
• The exit plan, Protect, hidden levels and alerts work while MetaTrader runs with the panel on at least one chart. A VPS keeps them running when the computer is off.
• In the Strategy Tester the panel is drawn and the rules run, but MetaTrader does not pass mouse clicks to Expert Advisors there, so the buttons cannot be used in a test.
• Window places are kept per chart; settings are kept per symbol profile in the Files folder of the terminal.
Closing words
A panel cannot make a trading idea better. What it can do is remove the small frictions that lead to mistakes: a lot size computed in a hurry, a stop that was meant to move to break-even, a rule broken on a bad day, a lesson never written down. Ziwox Trade Assistant puts the plan, the management, the protection and the review of each trade in one place on the chart, so that more of your attention goes to the market itself.
BUY THIS ADVANCE TOOL NOW

MQL4: https://www.mql5.com/en/market/product/207682
MAL5: https://www.mql5.com/en/market/product/208865




