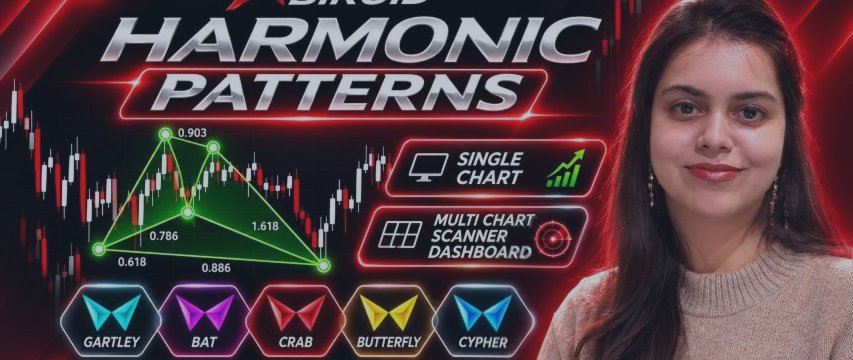

Abiroid Harmonic System — User Guide
MT4:
https://www.mql5.com/en/market/product/209085
MT5:
https://www.mql5.com/en/market/product/209086

The Single chart engine is free for now. But scanner is paid.
MT4:
https://www.mql5.com/en/market/product/209096/
MT5:
https://www.mql5.com/en/market/product/209097/


The system comes as two indicators, and both are created for MT4 and MT5:
| Indicator | What it does |
|---|---|
| Abiroid Harmonic Patterns | The chart engine. It finds harmonic patterns on the chart you attach it to, draws the full pattern, prints the Fibonacci ratios of each leg, shows an Accuracy Score, and projects the reversal zone (PRZ) while the pattern is still forming. |
| Abiroid Harmonic Patterns Scanner | A multi-pair dashboard. It scans many pairs on many timeframes at once and shows a table: which pairs have a completed harmonic pattern right now, which ones have a forming reversal zone, whether the old trend is losing momentum, and whether the pattern is landing near a strong pivot level. |
You can use each indicator on its own, but they are designed as a team: the Scanner tells you where something is happening, and the chart engine shows you what it looks like in detail.
1. A Quick Word on How Patterns Are Found
Both indicators share the same detection engine, so a pattern you see in the Scanner is drawn exactly the same way on the chart.
The engine reads the chart as a series of swings — the ups and downs that price makes. From those swings it looks for 5-point structures labeled X → A → B → C → D:
- X to A — the main move (the "engine" of the pattern).
- A to B — the first pullback.
- B to C — the second move.
- C to D — the final pullback, which lands in the reversal zone.
A bullish pattern looks like the letter M (price should reverse up at D). A bearish pattern looks like the letter W (price should reverse down at D).
For each pattern type, the engine checks the size of each leg against classic Fibonacci ratios (for example, in a Gartley the AB leg should be roughly 61.8% of the XA leg). A pattern is only reported when all of its leg ratios fall inside the allowed ranges for that pattern.

2. What the Chart Engine Draws
When you attach Abiroid Harmonic Patterns to a chart, you will see:
| On the chart | Meaning |
|---|---|
| Solid zig-zag lines through five points | The completed pattern: X, A, B, C, D. Green for bullish (M-shape), red for bearish (W-shape). |
| Thin dotted lines inside the pattern | The measured legs XB, AC and BD. These are the lines the Fibonacci ratios are calculated from. |
| Small numbers on each leg (e.g. 0.618) | The actual Fibonacci ratio of that leg, measured from price. You can compare these to the textbook values yourself. |
| Pattern name and a percentage near point D | The pattern type (Gartley, Bat, etc.) and its Accuracy Score — see section 3. |
| Shaded or outlined rectangle to the right of C | The PRZ (Potential Reversal Zone). This is where point D is expected to land while the pattern is still forming. The label reads "PRZ:" followed by the pattern name(s) that project into this zone. |
| Up/down arrow at point D | A completed pattern's entry marker. Up arrow = bullish reversal, down arrow = bearish reversal. |
| Triangles between the points | Optional shading of the two halves of the pattern (X-A-B and B-C-D). Off by default. |
One important habit: the PRZ rectangle appears before the pattern is complete. It is a projection, not a signal. More on that in the "How to Trade" section — this distinction is the single most important thing in this guide.
3. The Accuracy Score
Every completed pattern gets a score from 0 to 100%. It answers one question: how close are this pattern's leg ratios to the textbook ratios?
- 100% — every leg lands exactly in the middle of the ideal range. A textbook pattern.
- Around 90%+ — a clean, well-formed pattern.
- Lower scores — the legs are stretched or shallow compared to the ideal, but still inside the allowed tolerance.
The score is a ranking tool, not a pass/fail filter. Patterns with more ratio rules (like the Crab) naturally spread across a wider score range. Use the score to prefer the best-formed patterns when you have several on screen.
On the chart engine the score is shown next to D when "Show Accuracy Score %" is enabled. In the Scanner you can see the score by hovering over a cell — the tooltip shows it as "Score: XX%".
4. Patterns Detected
16 patterns are detected out of the box. All of them can be turned on/off or re-tuned in the config file (section 6). Here is what makes each one special:
| Pattern | What makes it special |
|---|---|
| Gartley | The classic harmonic. D lands around the 78.6% retracement of the XA leg, with B near 61.8%. The most frequent well-behaved pattern. |
| Bat | Like a Gartley but D lands deeper, around the 88.6% retracement of XA. Reversals often come very close to X. |
| Butterfly | D extends beyond point X (about 1.27 to 1.618 times XA). Catches turns after the market overshoots a swing. |
| Crab | The extreme version. D lands around 1.618 times XA beyond X. Rare, but the reversal zone is very tight, which allows small stops. |
| Deep Crab | A Crab variation where the B pullback is unusually deep (around 88.6% of XA). |
| Cypher | The C leg extends beyond A (about 1.272 to 1.45 times AB) and then D pulls back to the 78.6% area of XA. |
| Shark | A cousin of the Cypher. C also extends beyond A, and D typically lands around the X area of the structure. |
| ABCD | The simplest structure — two connected legs where the second move roughly equals the first. No strict X-point rule. |
| 5-0 | The odd one out: after an extended C leg, D is only a shallow pullback (about 50% of BC). The only pattern where D is not a deep retracement. |
| Alt Bat | A Bat variation with a very shallow B (around 38.2–42%) and D at 1.13 times XA. |
| Anti Gartley / Anti Bat / Anti Butterfly / Anti Crab | "Anti" versions of the classic patterns. The middle of the structure extends instead of retracing. They show up in strong trending markets, where normal pullback patterns keep failing. |
| White Swan / Black Swan | Rare extreme structures where the first pullback is huge (2.0 to 3.618 times XA). When they appear, they mark dramatic tops and bottoms. |

5. Chart Engine Settings
Here is every input of Abiroid Harmonic Patterns, grouped the way they appear in the settings dialog, using the names you see there.
General
| Setting | Default | What it does |
|---|---|---|
| Object Prefix | ABR_HP | The name tag used for everything the indicator draws. If you run the indicator on two charts, give one of them a different prefix so their objects don't clash. |
| Refresh after Ticks | 100 | How often the chart is re-scanned. It always re-scans on every new bar, and additionally every N ticks. Higher = lighter on the CPU. |
Harmonic Config
| Setting | Default | What it does |
|---|---|---|
| Config INI in Common Files | HarmonicPatterns.ini | The rules file with the Fibonacci ranges for every pattern. See section 6. It lives in the shared Common\Files folder, so MT4 and MT5 read the same file. |
| ZigZag Depth | 12 | Swing detection sensitivity (lower values = more, smaller swings). |
| ZigZag Deviation | 5 | Minimum distance price must travel before a swing counts. |
| ZigZag Backstep | 3 | Minimum bars between two swings. |
| Max Past Bars to Scan | 5000 | How far back into history the indicator looks for patterns. |
| NRP Mode (Show Repainted Past Patterns) | true | Keeps historical patterns on the chart even if they were later reshaped by newer price action. Repainted ones are drawn darkened so you can tell them apart. See section 7 — this is a setting you should understand. |
| NRP Mode Older Patterns Darken % (0-100) | 60 | How strongly repainted patterns are dimmed. |
ATR Size / Volatility Filter
| Setting | Default | What it does |
|---|---|---|
| Enable ATR Size & Activity Filter | true | Master switch for the two filters below. They remove noise: patterns that are too small, or that formed while the market was dead flat. |
| Baseline ATR Bars Lookback | 100 | How many bars are used to measure the market's "normal" volatility. |
| Min Pattern Height (x Ref ATR, 0: Off) | 3.5 | A pattern must be at least 3.5 times the average candle size to be shown. Raise it on low timeframes if you get too much clutter. |
| Min Activity Ratio AvgTR/BaseATR (0: Off) | 0.70 | The market must have been at least 70% as active during the pattern as its recent normal. Filters patterns that formed in a quiet, grinding market. |
Pattern Proximity / Overlap
| Setting | Default | What it does |
|---|---|---|
| Allow Overlapping Patterns (Share Swings) | true | Allows two patterns to share some of the same price action (e.g. a Bat and a Gartley over the same swings). Turn it off if you only want one pattern per area. |
| Min Bars Between Patterns at Point D (0: Disabled) | 0 | Minimum spacing between the D points of two patterns, in bars. Raise it to thin out clusters of signals. |
Alerts
| Setting | Default | What it does |
|---|---|---|
| Alert on New Pattern Detected | true | Pops an alert when a pattern completes on the current or previous bar. |
| Popup Alerts / Sound Alerts / Sound file name / Send push notification / Send email / File Alerts (In MQL4/Files/) / Custom File Name | Popup on | Standard alert delivery options. Push notifications need your MetaQuotes ID in the terminal options; email needs the email settings. |
Display
| Setting | Default | What it does |
|---|---|---|
| Show Accuracy Score % | true | Prints the accuracy score next to point D. |
| Show Forming D PRZ Zone | true | Draws the PRZ rectangle while the pattern is still forming (X-A-B-C exist, D not yet printed). |
| PRZ Extend Bars Into Future | 30 | How far to the right the PRZ rectangle reaches. |
| PRZ Zone Bullish Color (dark tint) / PRZ Zone Bearish Color (dark tint) | dark green / dark red | Fill/outline colors of the PRZ rectangle. |
| Fill PRZ Zone (false = outline) | false | Solid fill vs. outline for the PRZ rectangle. |
| Fill Triangles | false | Solid fill of the two pattern halves. |
| Pattern Line Width | 3 | Thickness of the pattern lines. |
| Bullish Pattern Color / Bearish Pattern Color | green / red | Main pattern colors. |
| Show Entry Arrows at Point D | true | Up/down arrows at completed D points. |
| Bullish Arrow Code (Wingdings) / Bearish Arrow Code (Wingdings) | 233 / 234 | Arrow symbol style (Wingdings font codes). |
6. Tuning Patterns with the INI File
The Fibonacci rules for all 16 patterns live in one file:
Terminal data folder → Common → Files → HarmonicPatterns.ini
It is created automatically with sensible defaults the first time you run any of the two indicators. Because it is in the Common folder, your MT4 and MT5 terminals (and the Scanner on both) all read the same rules — edit once, applies everywhere.
The file has one section per pattern plus a [GLOBAL] section:
| Key | Meaning |
|---|---|
| Enabled | 1 = pattern is scanned, 0 = pattern is switched off completely. |
| XB_min / XB_max | Allowed size of the AB leg, as a ratio of the XA leg. |
| AC_min / AC_max | Allowed size of the BC leg, as a ratio of the AB leg. |
| BD_min / BD_max | Allowed size of the CD leg, as a ratio of the BC leg. |
| XD_min / XD_max | Where D may land, as a ratio of the XA leg. Values above 1.0 mean D goes beyond point X (Butterfly, Crab...). |
| MinBars / MaxBars | How many bars the whole pattern may span (per pattern). |
| [GLOBAL] AllowedDeviationPct | Every ratio range gets a ±5% tolerance cushion. Lower = stricter patterns, higher = more (and looser) patterns. |
| [GLOBAL] MinBarsTotal / MaxBarsTotal | Default pattern length limits for all patterns. |
Useful edits:
- Too many patterns? Set Enabled=0 for the patterns you don't trade. Most traders start by keeping Gartley, Bat, Butterfly and Crab only.
- A pattern behaves badly on your market? Tighten its ranges, e.g. narrow XD for the Butterfly.
- Want to disable one ratio check? Set both values of that ratio to -1. For example, the 5-0 pattern ships with the XD check disabled (-1).
- Want everything back to default? Delete the file — it is recreated on the next start.
Restart the indicator (or refresh the chart) after editing the file.
7. Repainting and NRP Mode — Read This Before You Trade
This is the most important section in this guide.
Harmonic patterns are drawn from swing points. While price is still moving, those swing points can change:
- If price keeps making lower lows, the expected D point of a bullish pattern keeps sliding down. The PRZ moves with it.
- If price runs past the old extreme, the swing structure itself is re-drawn, and a pattern that was on the chart can disappear or change shape.
This is normal for any indicator that works with swing points — it is the nature of the tool, not a fault. But it has one big practical consequence:
Never jump into a trade the moment you see a PRZ or a fresh pattern. While the trend is still running, the signal is a moving target. A PRZ says "IF price turns around in this area, THEN a pattern completes here" — it does not say the turn has happened.
The indicators give you two ways to see this honestly:
- On the chart: with "NRP Mode (Show Repainted Past Patterns)" enabled, historical patterns that were later reshaped stay visible, drawn in a darkened color. This shows you exactly how often the structure shifted after the fact — and why you wait for confirmation.
- In the Scanner: with "NRP Mode (Show & Flag Repainted Pattern)" enabled, a reshaped pattern is marked with [R] next to its name and dimmed. Fresh, untouched patterns are highlighted with a solid green/red background; repainted ones are not highlighted.

The correct reading of a signal is therefore:
- A PRZ is a heads-up: "a pattern may complete here. Watch it."
- A completed pattern means D has actually printed: "the structure is real — now check if the turn is confirmed."
- A confirmed trade needs the old trend to be losing strength as D completes. That confirmation is what the next section is about.

Price Levels:
You can also set it to display Pivots or Full/Half/Quarter Levels based on what you trade with.
Remember that in Auto mode if you don't specify a multiplier, the "Full/Half/Quarter Levels" are based on your chart's min and max prices.
So if you zoom in or resize your chart the levels will change automatically. If you want fixed levels then set a "Major Level Spacing" value.
This will turn off the auto mode and use your spacing instead.
8. The Scanner
The Scanner watches many pairs and timeframes at once and draws one dashboard table:
- Each row is one pair (from your "Custom List (Eg: EURUSD,GBPUSD,USDJPY,AUDUSD)" input, or Market Watch if the list is empty).
- Each column is one timeframe (from "Timeframes(M1,M5,M15,M30,H1,H4,D1,W1,MN1)", default M15, M30, H1, H4).
- Each cell is one pair + timeframe combination, and it packs four things into a small space: a picture of the pattern, the pattern status line, a momentum note, and a pivot note.

What every symbol and text in a cell means
| You see | Meaning |
|---|---|
| "Gartley (3b)" in green or red | A completed pattern: name, and how many bars ago D printed. Green = bullish pattern, red = bearish. "(3b)" = D was 3 bars ago. The fresher, the more relevant. |
| Small up/down arrow on the left of the cell | Direction of the completed pattern. Up arrow = bullish reversal expected, down arrow = bearish. |
| Small zig-zag picture | A mini drawing of the actual pattern shape (X-A-B-C-D), scaled from real price data. Lets you judge the pattern's look at a glance without opening the chart. |
| Green or red cell background | The pattern is fresh: D printed within "Alert Bars Back for New Patterns" bars and it has not been repainted. Green background = bullish fresh signal, red = bearish fresh signal. No background = older pattern. |
| [R] after the pattern name, dimmed text | The pattern was repainted — its swings changed after it first appeared (needs "NRP Mode (Show & Flag Repainted Pattern)" enabled). Treat these as historical context, not signals. |
| "PRZ: Bat" in yellow | No completed pattern yet, but one is forming: price is heading into the reversal zone of a Bat (or whichever pattern names apply). Several patterns can project into the same zone; the tooltip lists them all. This is a "watch list" marker, not a signal. |
| "QQE: Slowing" in green | The move that led into the pattern is losing momentum — the old trend is fading. This is what you want to see before entering (details in section 9). |
| "QQE: Not Slow" in orange-red | The old trend still has strength. The pattern exists, but momentum has not turned — wait. |
| "Near D.PP" / "Near W.S1" / "Near Rnd50" in gold | Point D (or the PRZ zone) sits close to a Daily pivot (D.PP, D.R1, D.S1, D.R2, D.S2), a Weekly pivot (W.PP, W.R1, W.S1) or a round 00/50 level. Strong price levels near your reversal = extra confluence. You can switch each group on/off with the "Check Daily Classic Pivots..." inputs. |
| "--" | Nothing found on this pair + timeframe right now. |
| "NA" in gray | History for this symbol is not loaded yet (common for fresh MT5 symbols). It fills in automatically on a later refresh, or as soon as you open that pair's chart once. |
What the Symbol column shows
| You see | Meaning |
|---|---|
| Pair name | The symbol being scanned on that row. |
| Two small vertical bars (green/yellow/orange/red) | Currency strength meters: one bar for the base currency and one for the quote currency of the pair. Green = strong, red = weak. Hover over them for exact values (e.g. "EUR: 6.2 / USD: 3.1"). Powerful filter: a bullish EURUSD signal is more interesting when the EUR bar is strong and the USD bar is weak. |
| "Spr: 12" | Current spread of that pair in points, so you can spot expensive-to-trade pairs instantly. Pairs whose spread exceeds "Max Spread (0:Disable)" are skipped entirely until their spread normalizes. |
Tooltips and clicking

- Hover any cell — a tooltip shows full details: pattern direction and name, bar age, accuracy score, repainted flag, the exact QQE momentum values, the exact pivot level and price, and "STRONG CONFLUENCE" when both the QQE is slowing AND the pattern is near a strong pivot at the same time.
- Click any cell — opens that pair on that timeframe in a new chart window (with "OnButtonClick Open New Window"). With "Open New Window only if Doesn't exist" it reuses an existing window instead. "Use Template For New Window" applies one of your saved chart templates — handy for loading your harmonic chart setup automatically.
Scanner Settings
Scanner-specific inputs, grouped as they appear in the dialog:
Pair/Timeframe Settings
| Setting | Default | What it does |
|---|---|---|
| Timeframes(M1,M5,M15,M30,H1,H4,D1,W1,MN1) | M15,M30,H1,H4 | Columns of the table. Any list of timeframes, comma separated. |
| Custom List (Eg: EURUSD,GBPUSD,USDJPY,AUDUSD) | 7 USD majors | Rows of the table. Use exact broker symbol names, comma separated. Leave empty to scan whatever is in Market Watch. |
Currency Strength (Symbol Column)
| Setting | Default | What it does |
|---|---|---|
| Show Currency Strength Bar in Symbol Column | true | Show/hide the strength bars. |
| Strength Mode (SMA Cross / Daily Range) | SMA Cross | How strength is measured: momentum style (SMA cross) or daily range style. |
| SMA Period (Strength Mode = SMA Cross) | 20 | Lookback for the SMA strength mode. |
Harmonic Engine Settings / ATR Filter / Overlap
Identical to the chart engine (section 5) with two differences: "Max Past Bars to Scan" defaults to 1000 here (the scanner keeps its history window lighter), and "NRP Mode (Show & Flag Repainted Pattern)" defaults to false.
QQE Trend-Slowing Note (Row 2)
You don't need to buy the QQE, but if you need to see it on chart to visualize then here's the link:
https://www.mql5.com/en/blogs/post/763582
| Setting | Default | What it does |
|---|---|---|
| Show QQE Slowing Note | true | Show/hide the "QQE: Slowing / Not Slow" line in each cell. |
| Primary RSI Length / Primary RSI Smoothing / Primary QQE Factor | 6 / 5 / 3.0 | The QQE momentum settings used for the fading-trend check. Defaults match the classic fast QQE. |
| Secondary RSI Length / Secondary RSI Smoothing / Secondary QQE Factor | 6 / 5 / 1.61 | Reserved for the secondary QQE line (matches the Abiroid DualPulse QQE defaults, see section 9). |
Strong Pivot Note (Row 3)
| Setting | Default | What it does |
|---|---|---|
| Show Strong Pivot Note | true | Show/hide the "Near ..." line in each cell. |
| ATR Period for Pivot Proximity / Pivot Proximity (% of ATR, e.g. 50) | 14 / 50 | How close a pivot must be to count as "near": within 50% of the average candle size. Tighten it if you only want dead-on hits. |
| Check Daily Classic Pivots (D.PP/R1/S1/R2/S2) | true | Include yesterday-based daily pivots. |
| Check Weekly Classic Pivots (W.PP/R1/S1) | true | Include weekly pivots. |
| Check Round 00/50 Psychological Levels | false | Include round numbers ending in 00/50 (pips). |
Alert, Display and Colors
| Setting | Default | What it does |
|---|---|---|
| Alert Bars Back for New Patterns | 3 | A cell only gets the colored background + alert when its D is at most this many bars old (and not repainted). |
| Window Width / Height / X / Y, Font Size, Cell Width / Height, Symbol Column Width (0: Auto) | 800 / 460 / 30 / 40, 10, 170 / 54, 105 | Size and position of the dashboard on your chart, and its fonts/cell sizes. |
| Shift | 1 | Scans closed bars only (1 = signals are evaluated on finished candles). Keep it at 1. |
| Max Past Bars / Past Bars BackAlerts | 100 / 1 | Generic framework settings inherited by all Abiroid scanners. The harmonic scan uses "Max Past Bars to Scan" instead — you can ignore these two. |
| Refresh after ticks | 200 | Refresh rate of the whole table. |
| Max Spread (0:Disable) | 0 | Skip a pair's row when its spread is above this value (points). |
| Color inputs (Bullish Text Color, Forming PRZ Text Color, QQE Old Trend Slowing Color, Near Strong Pivot Color, Bullish Signal BG, etc.) | — | Every color on the dashboard can be changed to fit your chart theme. |
9. How to Trade — The Right Way
Please read this whole section before trading the signals. It is the difference between using harmonics well and getting chopped up.
Golden rule: never trade the signal the instant it appears
As explained in section 7, harmonic patterns are built from swings, and swings keep adjusting while the trend keeps running:
- Price makes a higher high → the bearish pattern's D keeps moving up.
- Price makes another higher high → the D moves up again, and the whole pattern gets redrawn.
You can watch exactly this behavior on the chart with NRP Mode enabled — the darkened repainted patterns are the fingerprints of every time the signal shifted. So:
A PRZ is a place to WATCH, not a place to BUY. And even a freshly completed pattern is only the structure — the trade still needs momentum confirmation.
The 4-step routine
- Spot. The Scanner shows a yellow "PRZ: Bat" cell, or the chart engine draws the PRZ zone. Add the pair to your watch list. Do nothing yet.
- Wait for D to print. Price enters the zone and turns. The cell changes from "PRZ: ..." to the pattern name with an arrow, and the chart draws the complete X-A-B-C-D. Now the structure is real.
- Wait for the old trend to fade. This is the entry trigger — see below. No fading momentum = no trade, however pretty the pattern.
- Check the location. If D lands at a strong level — daily/weekly pivot, round number, old swing high/low — the setup gets a real boost. The Scanner tells you this directly: the gold "Near D.PP" note, and "STRONG CONFLUENCE" in the tooltip when fading momentum and strong level happen together.
Checking "trend fading" — example with a QQE
"Trend fading" means: the move that led into point D is running out of strength. The Scanner checks this for you automatically on every cell (the QQE row). But you should also be able to see it yourself on a momentum indicator. Any momentum tool works — RSI, MACD histogram, Stochastic, or a QQE. As a worked example, here is how to do it with an QQE-style indicator (for instance the Abiroid DualPulse QQE, which the Scanner's built-in check is aligned with — you don't need to own it, any QQE or even plain RSI shows the same thing):
Example for a bullish pattern (you want to buy the reversal up at D):
- While price was falling into D, the QQE histogram/line was below zero, making lower values with the downtrend.
- Fading sign: price pushes to a new low (or re-tests the zone), but the QQE stops falling and starts curling back up toward zero. The down-move is losing its punch. Even better if price makes a lower low while the QQE makes a higher low — that is classic momentum divergence.
- Optional tighter trigger with the DualPulse style: the fast (primary) QQE line crossing back above its slower (secondary) line, or a zero-line cross.
- Enter when the fading is visible AND the candle action in the zone supports it (e.g. a bullish engulfing or pin bar at D).
For a bearish pattern, mirror everything: you want the rally into D to stop lifting the QQE while price grinds to new highs.
In the Scanner, the same logic runs under the hood: "QQE: Slowing" (green) = the old trend's momentum has turned against itself — that is your fade signal. "QQE: Not Slow" (orange-red) = the old move is still strong — be patient. A cell that still says "Not Slow" is exactly the situation where trading early gets you run over by the last leg of the trend.

In a highly Bullish Trend, avoid the Bearish signals. The next signal in above screenshot which is bearish will be a bad signal.
Entries, stops and targets (a simple framework)
- Entry: market order on the confirmed fading signal (candle closes), or a limit order inside the PRZ while watching that the trend is actually fading. Aggressive limit entries fill better but catch more failed zones — the confirmed close is the safer default.
- Stop loss: beyond point X, or beyond the far edge of the PRZ plus a small buffer. If price closes beyond X, the pattern story is dead — exit, don't hope.
- Targets: the natural magnets are the pattern's own points: first target around point A (roughly the 38.2% retracement of the AD leg), second around the 61.8%, final target near point B or X. Take partial profit at the first target and move your stop to break-even — harmonic reversals frequently retrace the first leg fast.
- Invalidation: if the reversal stalls and price closes back through the PRZ against you, the pattern failed. Take the small loss; the Scanner will show you the next one.
10. Cheatsheets
Pair cheat sheet
| Pair / group | Character | What to look for / watch out for |
|---|---|---|
| EURUSD | Clean, well-behaved, tight spreads. The best pattern study market. | All patterns work. Great market to learn the routine on. Best with the default settings. |
| GBPUSD | Like EURUSD but spikier and faster. | Expect deeper overshoots — Butterflies and Crabs are common. Give stops a little more room. |
| USDJPY | Trendy, directional, long clean legs. | Strong trends produce the "Anti" patterns and extended D points. Wait extra hard for the momentum fade before countertrend trades. |
| AUDUSD / NZDUSD | Range-friendly, moderate pace. | Gartleys and Bats at range edges are their bread and butter. Watch the Asian session flat spells (the activity filter helps). |
| USDCAD | Slower, oil-sensitive, can stall before news. | Fine for higher-timeframe patterns. Avoid holding through oil inventory days if trading CAD-side setups. |
| USDCHF | Mirrors EURUSD behavior. | When EURUSD shows a clean pattern, USDCHF often shows the inverted twin — useful as a cross-check. |
| Gold (XAUUSD) and metals | Huge emotional swings. | Trade the higher timeframes (H1+), and raise "Min Pattern Height (x Ref ATR, 0: Off)" so tiny noise patterns don't clutter. Reversals at Butterflies/Crabs can be violent — in your favor when confirmed. |
| Indices | Trendy with session gaps. | Gaps can jump over your zone — check what the D1 chart did overnight. US indices: the open hour produces the sharpest reversals. |
| Crypto | 24/7, extreme extensions. | Patterns run to extreme D points often (Crabs, deep Butterflies). Position size smaller; the momentum-fade check is not optional here. |
Timeframe cheat sheet
| Timeframe | Feel | Tips |
|---|---|---|
| M5 / M15 | Lots of patterns, lots of noise. | Only trade these during London/NY hours. Raise the ATR filter if the chart gets cluttered. Always take the higher-timeframe trend into account. |
| M30 / H1 | The sweet spot for this system. | Best balance of signal quality and trade frequency. Defaults are tuned for this range. |
| H4 / D1 | Few signals, strongest reactions. | Patterns at weekly pivots on H4/D1 are the highest-quality setups this system finds. Be patient — several may be worth weeks of waiting. |
| Multi-TF habit | — | Read the Scanner row left-to-right: a bullish H1 pattern inside a bullish H4 structure is a with-trend entry. A bullish M15 pattern against a fresh bearish H4 pattern is a trap — skip it. |
Session cheat sheet (server time varies by broker — adjust to yours)
| Session | Behavior |
|---|---|
| Asian hours | Quiet. Patterns form but often just drift. Good for watching, average for trading. |
| London open | First real expansion of the day. Reversals of the Asian range at completed patterns are a repeatable favorite. |
| NY open | Second expansion, often reverses the London extreme. Butterflies and Crabs love this window. |
| Rollover / late Friday | Thin liquidity, spread spikes. The spread row in the Scanner warns you — respect it. |
Pre-trade checklist (what to look for before you click the button)
- Completed, fresh pattern — D has printed, cell shows arrow + colored background, no [R] flag.
- Form — accuracy score is respectable (hover the cell), and the mini pattern shape looks clean.
- Fade — "QQE: Slowing" (or your own momentum tool shows the old trend fading).
- Location — "Near D.PP / W.S1 / Rnd50", or an obvious old swing level. Bonus points.
- Strength agreement — currency strength bars lean in your direction (bullish EURUSD: EUR bar strong, USD bar weak).
- Higher timeframe — the next timeframe up doesn't have a fresh pattern pointing against you.
- Costs — spread is normal for the pair.
Four or more boxes ticked = a trade worth taking. One or two = it is someone else's trade.
11. Troubleshooting / FAQ
| Symptom | Why / Fix |
|---|---|
| Scanner cells show NA | Symbol history is still downloading (mostly MT5). Wait for the next refresh or open that pair's chart once; cells fill in by themselves. |
| I see no patterns at all | Check the order: is "Enable ATR Size & Activity Filter" hiding small patterns? Is "Max Past Bars to Scan" big enough for your timeframe? Are the patterns you expect disabled in the INI? Is the market simply quiet (the activity filter is doing its job)? |
| Too many patterns, chart is cluttered | Raise "Min Pattern Height (x Ref ATR, 0: Off)", disable patterns you don't trade in the INI, and/or raise "Min Bars Between Patterns at Point D (0: Disabled)". |
| A pattern disappeared from the chart | That is repainting (section 7). Enable "NRP Mode (Show Repainted Past Patterns)" to keep the old versions visible, darkened. |
| Scores seem low on some patterns | Patterns with strict rules (Crab) measure their legs against tight targets — their scores sit lower naturally. Compare scores within the same pattern type. |
| The Scanner feels slow | Each cell is a full pattern scan. Fewer pairs, fewer timeframes, larger "Refresh after ticks", smaller "Max Past Bars to Scan" — in that order of impact. |
| I edited the INI, nothing changed | Make sure you edited the file in Common\Files (not a chart folder), saved as plain text, and re-attached/refreshed the indicator. Deleting the file restores all defaults. |
| Different results on MT4 vs MT5 | Small differences can come from broker history and symbol names. The detection rules themselves are identical — they share the same engine and the same INI. |
12. Quick Reference Card
- PRZ (yellow in Scanner / shaded zone on chart) = pattern forming. Watch, don't trade.
- Pattern name + arrow + colored background = pattern completed and fresh. Start the confirmation routine.
- "QQE: Slowing" = old trend fading = your entry trigger.
- "Near D.PP" / gold note = strong level at D = extra confluence.
- "STRONG CONFLUENCE" (tooltip) = fade + strong level together = best cells on the board.
- [R] / darkened pattern = repainted = history, not a signal.
- "NA" = history still loading. "--" = nothing there.
- Click a cell = open that chart. Hover a cell = full details.
Trade the routine, not the arrow: spot → wait for D → wait for the fade → check the level → enter. Happy hunting!




