Scalper Nasdaq: a NASDAQ 100 scalper tested on 234 million real ticks

Most scalping robots are shown with backtests built from generated ticks: the tester takes each M1 bar and invents the price path inside it. For a strategy that holds trades for minutes, those invented paths decide almost everything: where the stop gets hit, whether the target fills first, what the spread costs. A scalper can look excellent on generated ticks and fall apart on a live account.
So Scalper Nasdaq was tested the other way: on the broker's own recorded ticks.
The test
- Mode: "Every tick based on real ticks", MetaTrader 5 Strategy Tester
- Data: 234,703,009 real ticks, 1,355,765 M1 bars
- Period: 2023.01.01 to 2026.11.15, almost four years
- History quality: 100%
- Symbol: US100.cash, M1, default inputs, 200,000 USD deposit, 1:100
Every tick in that test is a price the broker actually quoted, with the spread it actually had at that moment. Nothing inside the minute is guessed.
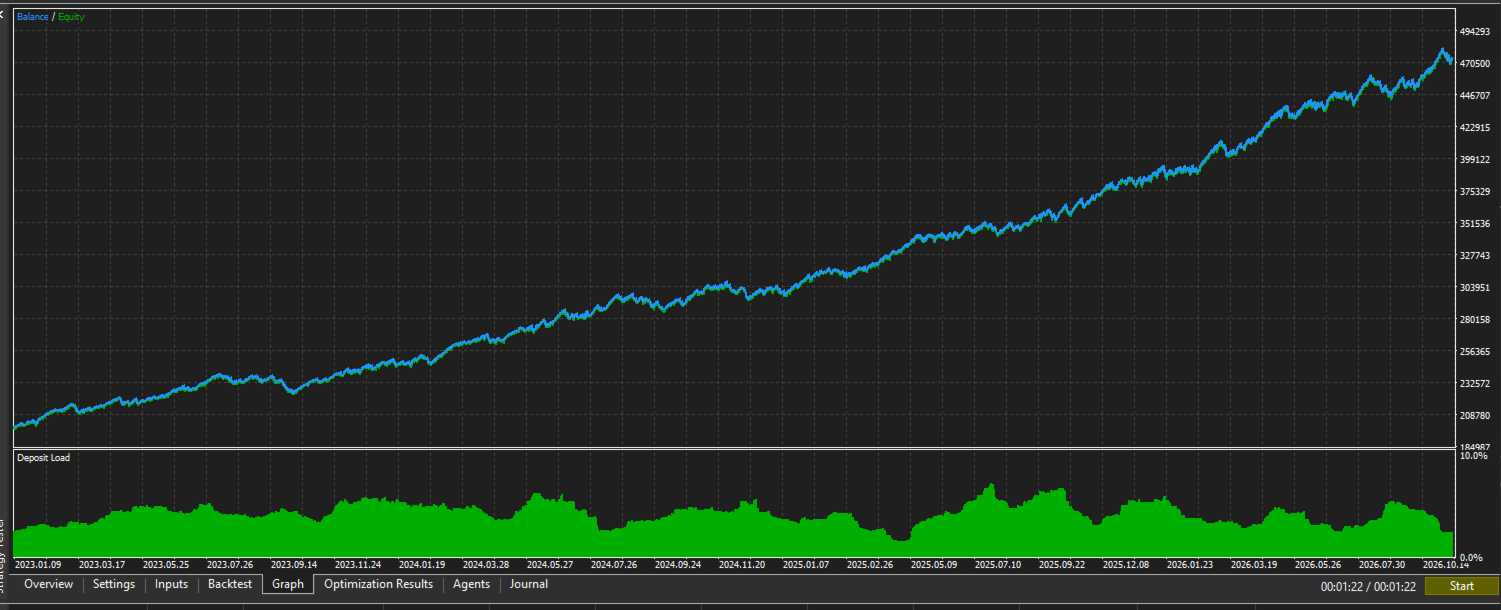
What the backtest showed
| Trades | 2,287 |
| Winning trades | 66.2% (long 67.0%, short 65.4%) |
| Profit factor | 1.31 |
| Maximum balance drawdown | 3.42% |
| Maximum equity drawdown | 6.33% |
| Recovery factor | 16.47 |
| Equity curve straightness (LR correlation) | 0.98 |
| Longest losing streak | 8 trades |
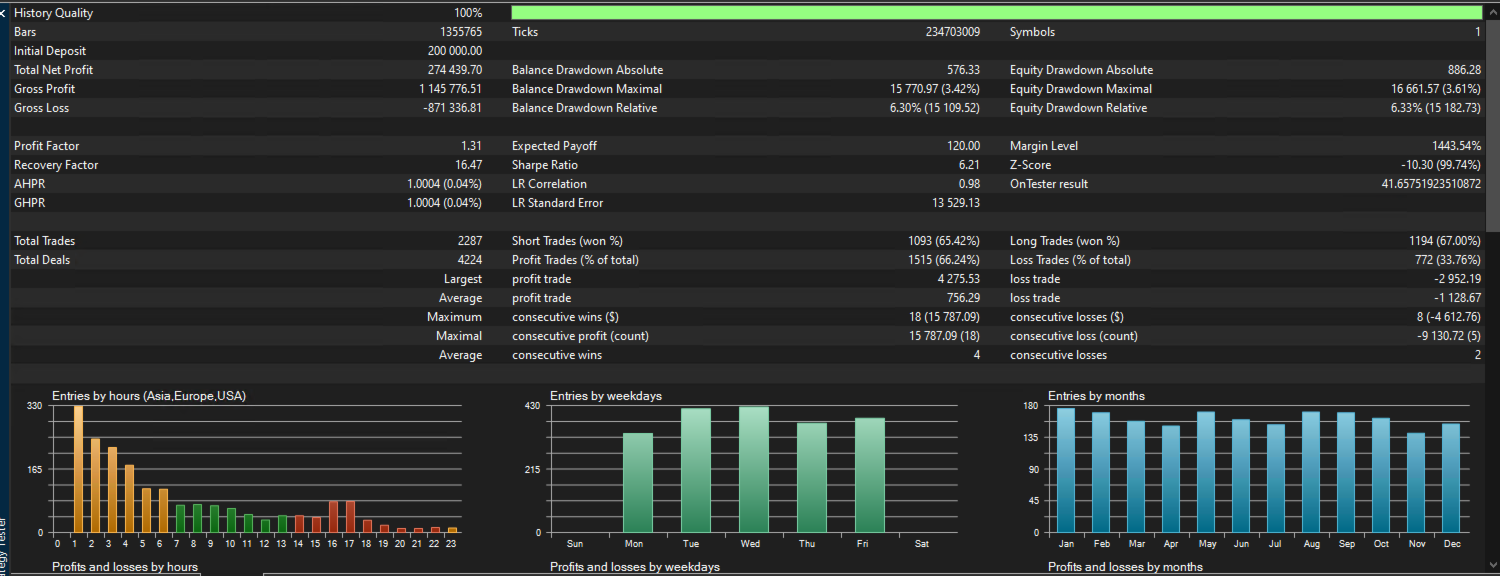
The number I care about most is the 0.98 line correlation: the curve climbs steadily across 2023, 2024, 2025 and 2026 instead of making its money in one lucky stretch. Entries are spread evenly over every weekday and every month of the year.
These are backtest results on historical data. They are not live trading results and they do not predict future results. Your broker's spread, commission and execution will change the numbers, so run it on a demo account first.
Watch it trade on real ticks
The video below is a recording of the Strategy Tester in visual mode on real ticks (US100.cash M1, 8 October 2026): entry with the stop already placed, half closed at the first target, the rest at the second target, and the day stopping once the daily target is reached.
Watch the video on YouTube (2:57)
30 minutes: 14 trading days on real ticks
A longer video: one full day from each of 14 different months, January 2023 to September 2026, with 11 winning days and 3 losing days. Each day was re-run on its own and matches the 4-year real-tick test trade for trade.
Watch the 30-minute video on YouTube
How it trades
Entry. Four signals vote: a Heiken Ashi colour flip on M15 and three moving-average crosses (M20 5/50, M5 13/30, M30 8/100). A trade opens only when a majority agrees. Three "don't" filters veto trades that go against the higher-timeframe direction.
Stop. Every trade has a stop loss from the moment it opens. The stop is 18% of the 20-day average daily range, so it widens on volatile days and tightens on quiet ones.
Exit. Half the position closes at 0.8 times the stop distance. The rest runs to 2.0 times, with the stop trailing in quarter-R steps. If the signal flips, the trade closes and the EA can reverse.
No martingale, no grid, no averaging down.
Risk control (all adjustable)
- 0.6% of the balance risked per trade, rounded down to the broker's lot step
- Daily target +0.18%: once reached, no new trades until tomorrow
- Weekly limits: +5% target, -3% loss
- The day stops after 4 losses in a row or a 3% drop from the day's high
- Spread filter, weekend flat (Friday 23:30 server time), optional news pause
Built for prop firm accounts
The default setup was built around the rules prop firm challenges use:
- Daily loss rule: the day drop guard closes everything and stops at -3% from the day's high, inside the common 5% daily limit
- Maximum loss rule: the largest equity drawdown in the four-year real tick test was 6.33%, inside the common 10% limit
- Stop loss on every trade from the moment it opens, 0.6% risk each
- No weekend holding: all trades close on Friday at 23:30 server time
- No martingale, no grid, no averaging down, which many firms forbid
- News pause available for firms that restrict trading around high-impact news
- Small, steady daily target (+0.18%), so the account grows step by step instead of through a few large trades
Check your firm's exact limits and set the daily and weekly limits to match them before you start.
Setup
Attach it to your broker's NASDAQ 100 CFD on the M1 chart (US100, NAS100, USTEC and similar names). It works on hedging and netting accounts. If it is attached to any other symbol or timeframe it warns you loudly, because the default inputs were built for NASDAQ 100 M1.
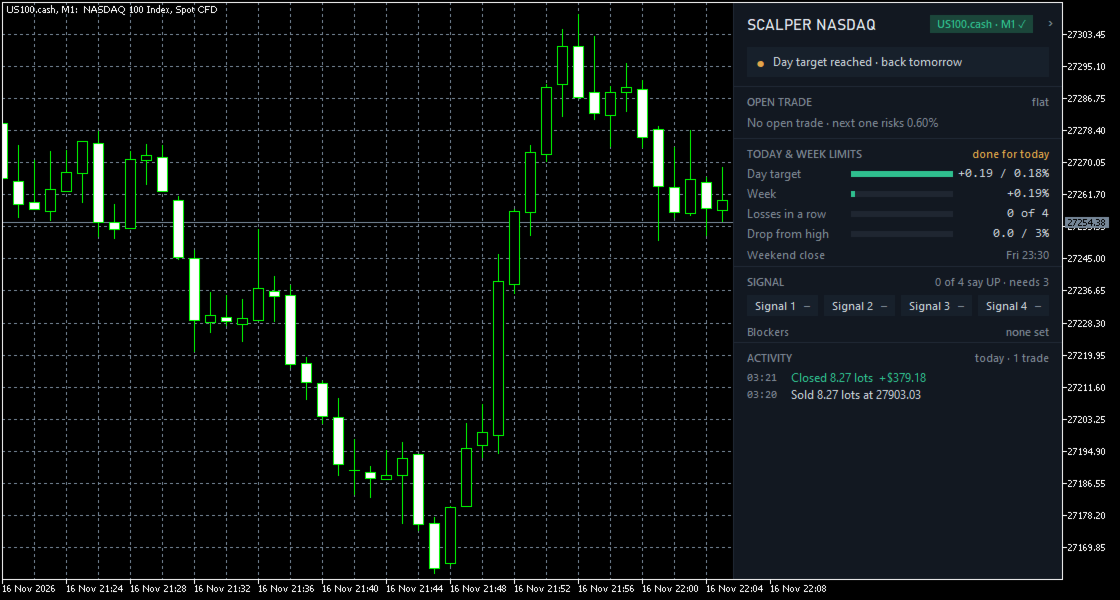
On a live chart the dashboard shows the open trade, today's target, the weekly limits, losses in a row and what each signal says right now:
Try it
Download the free demo and run it in your own Strategy Tester on real ticks. You can rent it for 1 month (49 USD) or buy it (399 USD, 10 activations).
Product page: https://www.mql5.com/en/market/product/208795
Video: https://youtu.be/UotOHpQeJ0o
Questions are welcome in the product comments.




