Volume Profile Sessions PRO · Daily Volume Profile · Volume Profile Delta B3 PRO — User Manual

Available on the MQL5 Market: Volume Profile Sessions PRO, Daily Volume Profile, Volume Profile Delta B3 PRO
Risk notice. Trading involves risk of loss. These indicators show where volume was traded on the chart; they do not predict the market, do not place trades and do not guarantee any result. Use them together with your own analysis and risk management, and test on a demo account first.
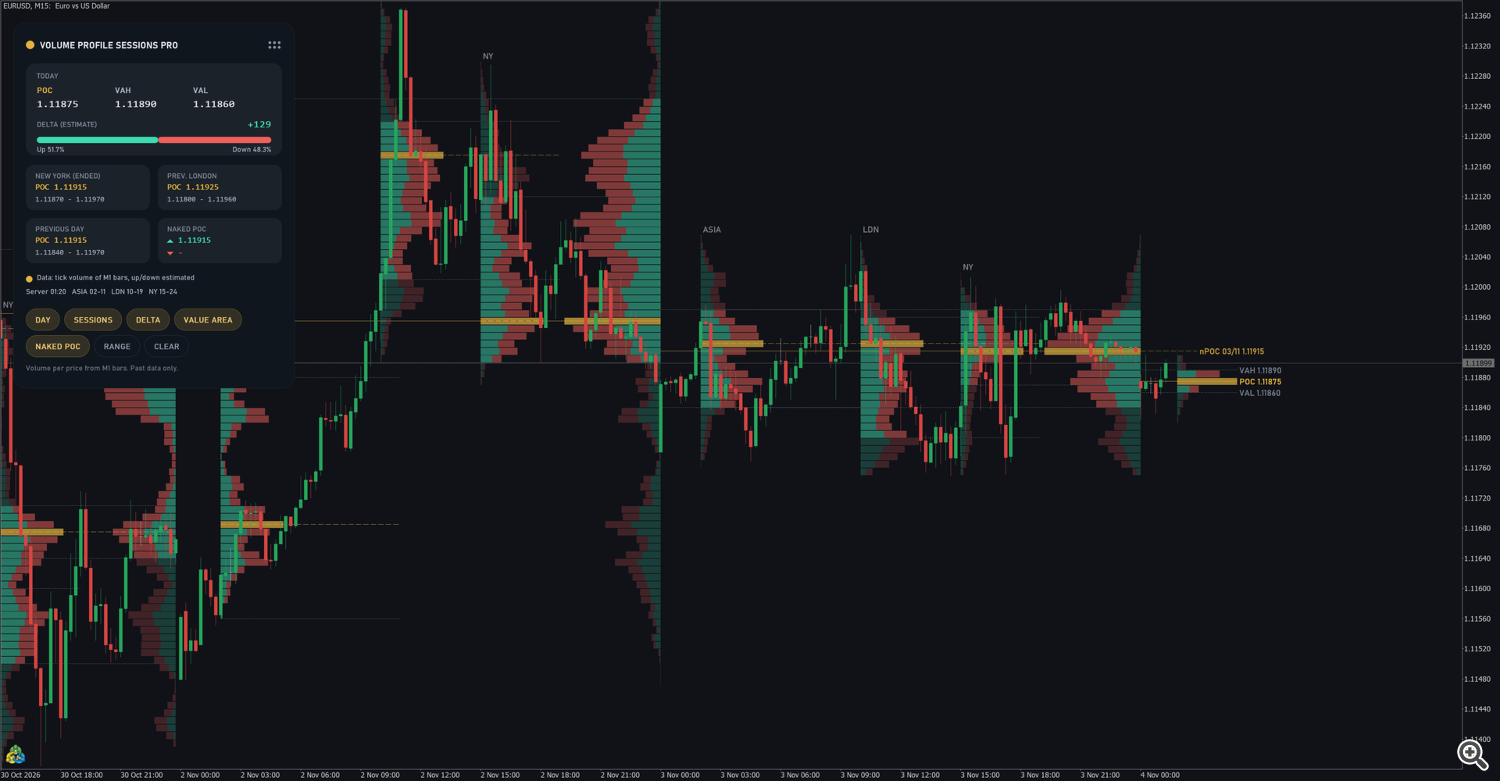
This manual covers three volume profile indicators that share the same way of drawing and reading a profile:
- Volume Profile Sessions PRO — Asia, London and New York session profiles plus the daily profile, for any symbol (forex, metals, indices, crypto, stocks), with naked POCs, fixed range profiles, estimated up/down volume, alerts and 13 buffers for Expert Advisors.
- Daily Volume Profile (free) — the profile of the current day with POC, VAH and VAL, for any symbol.
- Volume Profile Delta B3 PRO — daily profiles with real buy and sell aggression per price for B3 futures and stocks (WIN, WDO, IND, DOL, shares), naked POCs, fixed ranges, alerts, 10 buffers, and real trades in the Strategy Tester.
None of them opens trades.
1. Which edition?
| Daily Volume Profile (free) | Volume Profile Sessions PRO | Volume Profile Delta B3 PRO | |
|---|---|---|---|
| Symbols | any | any | B3 futures and stocks (feeds with real trades) |
| Data | 1-minute bars: real volume or tick volume | 1-minute bars: real volume or tick volume | real trades (time and sales) |
| Today's profile with POC / VAH / VAL | yes | yes | yes |
| Previous days | — | yes (Days to draw) | yes (Daily profiles to draw) |
| Asia / London / New York session profiles | — | yes, hours adjustable | — |
| Buy / sell split per row | — | up / down estimate | real buy / sell aggression |
| Naked POCs | — | days, optionally sessions | days |
| Fixed range profile (two clicks) | — | yes | yes (within one day) |
| Panel with buttons, draggable | panel only | yes | yes |
| Alerts | — | naked POC touch, previous day VAH / VAL | naked POC touch, previous VAH / VAL |
| Buffers for EAs | — | 13 | 10 |
| Strategy Tester | yes | yes, no preparation | yes; previous days need saved history (section 5.5) |
2. Installation and quick start
- Install the indicator from the Market tab of the terminal (Toolbox → Market → Purchased → Install; the free edition from the product page).
- Open a chart and drag the indicator from the Navigator (Indicators → Market) onto it.
- Keep the default inputs or adjust them (section 8) and press OK.
The first calculation needs history. The panel shows the progress while it waits:
| Panel message | Meaning |
|---|---|
| Waiting for daily history | The daily bars of the symbol are not loaded yet. The indicator tries again by itself. |
| Loading M1 history / Waiting for M1 history | The 1-minute bars are still downloading (Sessions PRO and Daily VP). |
| Downloading ticks of 28/10 (64%) / Loading history 3 / 11 | Volume Profile Delta B3 PRO is reading the trades of the previous days. |
Quick start
- Sessions PRO — check the session hours on the panel line Server 18:49 ASIA 02-11 LDN 10-19 NY 15-24 . The defaults fit brokers on GMT+2 / GMT+3; for another server time, change the six session inputs (section 4.2).
- Delta B3 PRO — open the chart of the contract you trade (for example WINZ26) on a timeframe below D1 and look at the Data: line of the panel: Exchange flags means the best data source (section 5.2).
- Daily VP — nothing to set; the profile grows during the day.
- Use the panel buttons to show or hide parts of the drawing; press RANGE and click two points on the chart for a profile of any period you choose.
3. Reading a volume profile
| On the chart | Meaning |
|---|---|
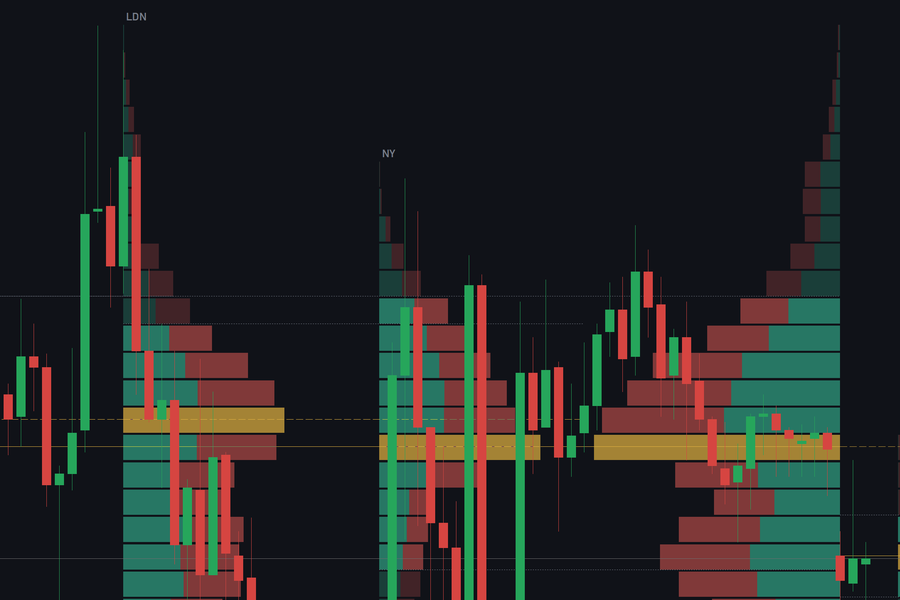
| Horizontal rows | Volume traded at each price of the period. The longest row has the most volume. |
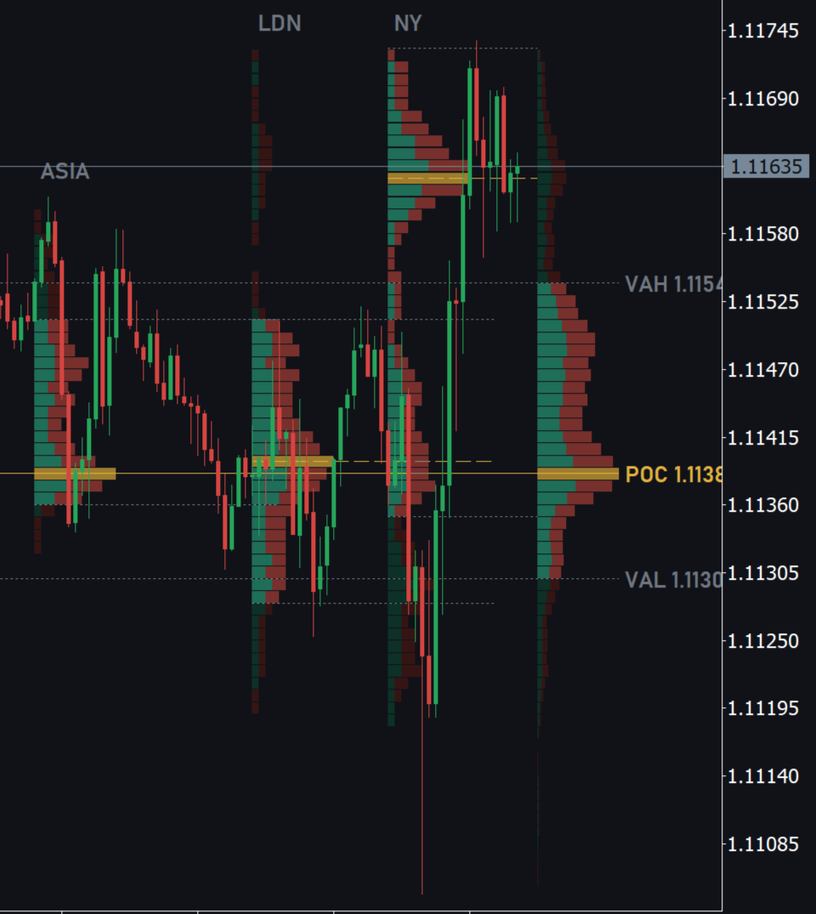
| Gold row and gold line (POC) | Point of control: the price with the most volume in the period. Solid line for days and ranges, dashed line for sessions. |
| Dotted lines VAH / VAL | Value area high and low: the price band that holds the Value area (%) of the volume (70% by default) around the POC. |
| Brighter rows / fainter rows | Rows inside the value area are brighter; rows outside are fainter (when VALUE AREA is on). |
| Green / red part of a row | Up / down volume (Sessions PRO, estimate) or buy / sell aggression (Delta B3 PRO). With DELTA off, or the split input off, rows are drawn in one colour. |
| Dashed gold line with label nPOC 28/10 1.11830 | Naked POC: the POC of an earlier day (or session) that price has not traded since that period ended. |
| Labels POC 1.11380 , VAH 1.11546 , VAL 1.11339 | Price labels at the right end of today's profile and of the most recent range. Older profiles show lines only, so their texts do not overlap the next profile. |
How traders often read it (no rule guarantees anything):
- The POC and the value area show the prices the market accepted in that period; prices outside the value area were traded less.
- A naked POC is a price where much volume was traded and that has not been revisited yet; many traders watch it as a reference level.
- The previous day's VAH and VAL are frequent reference levels for the next day.
All lines and texts follow the chart background: on a light background they are darkened, on a dark background they are blended toward it, so they stay readable. When you change the background colour in the chart properties, the drawing is redone with the new contrast.
4. Volume Profile Sessions PRO
4.1 What it draws
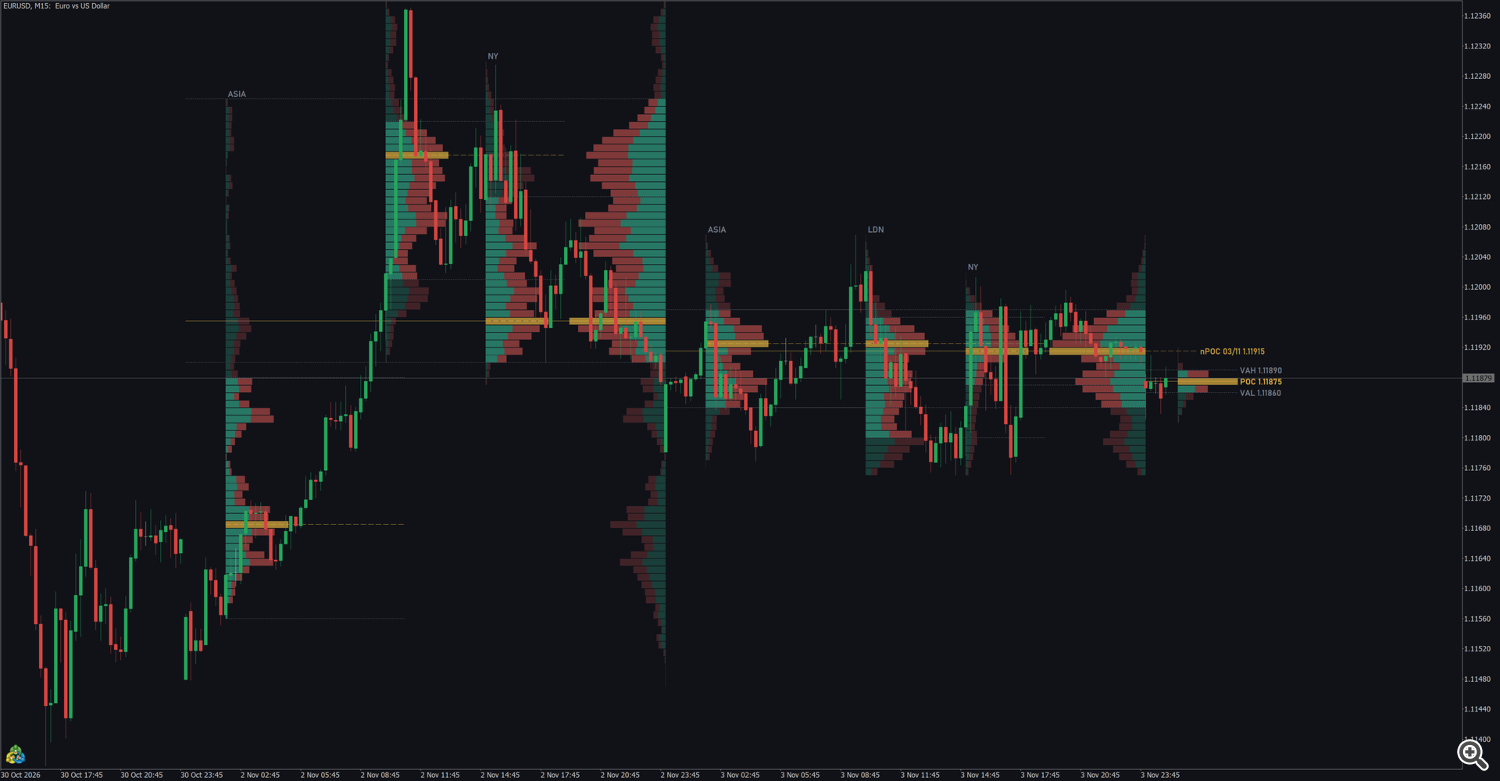
- Session profiles (Asia, London, New York): each one starts at the session start and grows to the right; its width is Session profile width (% of the session) of the session length. The session name ( ASIA , LDN , NY ) is written on top. The POC line of a session is dashed.
- Daily profile of each day:
- with SESSIONS on, a finished day is drawn at the end of the day, growing to the left (width Daily profile width (% of the day)), and today's profile is drawn in the free space to the right of the last bar, with its POC / VAH / VAL labels;
- with SESSIONS off, each day is drawn from the start of the day, growing to the right, with the width set by Session profile width.
- Days are calendar days of the broker server time.
- Days to draw (default 5) sets how many days are drawn.
4.2 Session hours
The six inputs Asia start / end, London start / end, New York start / end are in broker server time, written as HH:MM .
| Session | Default | Note |
|---|---|---|
| Asia | 02:00 – 11:00 | |
| London | 10:00 – 19:00 | |
| New York | 15:00 – 24:00 | 24:00 means the end of the server day |
- The defaults fit brokers on GMT+2 / GMT+3 (New York close), the most common server time. If your broker uses another server time, move the hours by the difference. The panel shows the current server time to help.
- A session whose end is earlier than its start continues into the next day (for example 22:00 – 06:00 ).
- A value that cannot be read (for example 9h ) falls back to the default of that session.
- Each session can be turned off with its own input (Asia session, London session, New York session).
- When two sessions overlap, the panel and the session buffers use the session that started last.
4.3 Up / down volume (estimate)
With Split each row into up and down volume (estimate) on (default) and the DELTA button on, each row is split in green (up) and red (down), and the panel shows DELTA (ESTIMATE) with the up / down share.
Sessions PRO works from 1-minute bars, which do not record who was the aggressor. The split is therefore an estimate from the bars, not real buy and sell aggression. Use it as a reading of the direction of activity inside the profile. For real aggression on B3, use Volume Profile Delta B3 PRO.
With the split input off, rows use Row color when not split and the panel shows the total VOLUME of the day instead of the delta.
4.4 Naked POCs

- The POCs of finished days within Days checked for untouched POCs (default 10) that price has not traded since the day ended are drawn as dashed gold lines from the end of their day to a few bars to the right of the last bar, labelled nPOC dd/mm price .
- With Also untouched session POCs on, session POCs are added (label nPOC LDN 28/10 price ).
- A naked POC disappears when price trades at it.
- The NAKED POC card of the panel shows the nearest naked POC above (▲) and below (▼) the current price.
- The NAKED POC button hides or shows the lines. The naked POC alert keeps working when the lines are hidden.
4.5 Fixed range profile
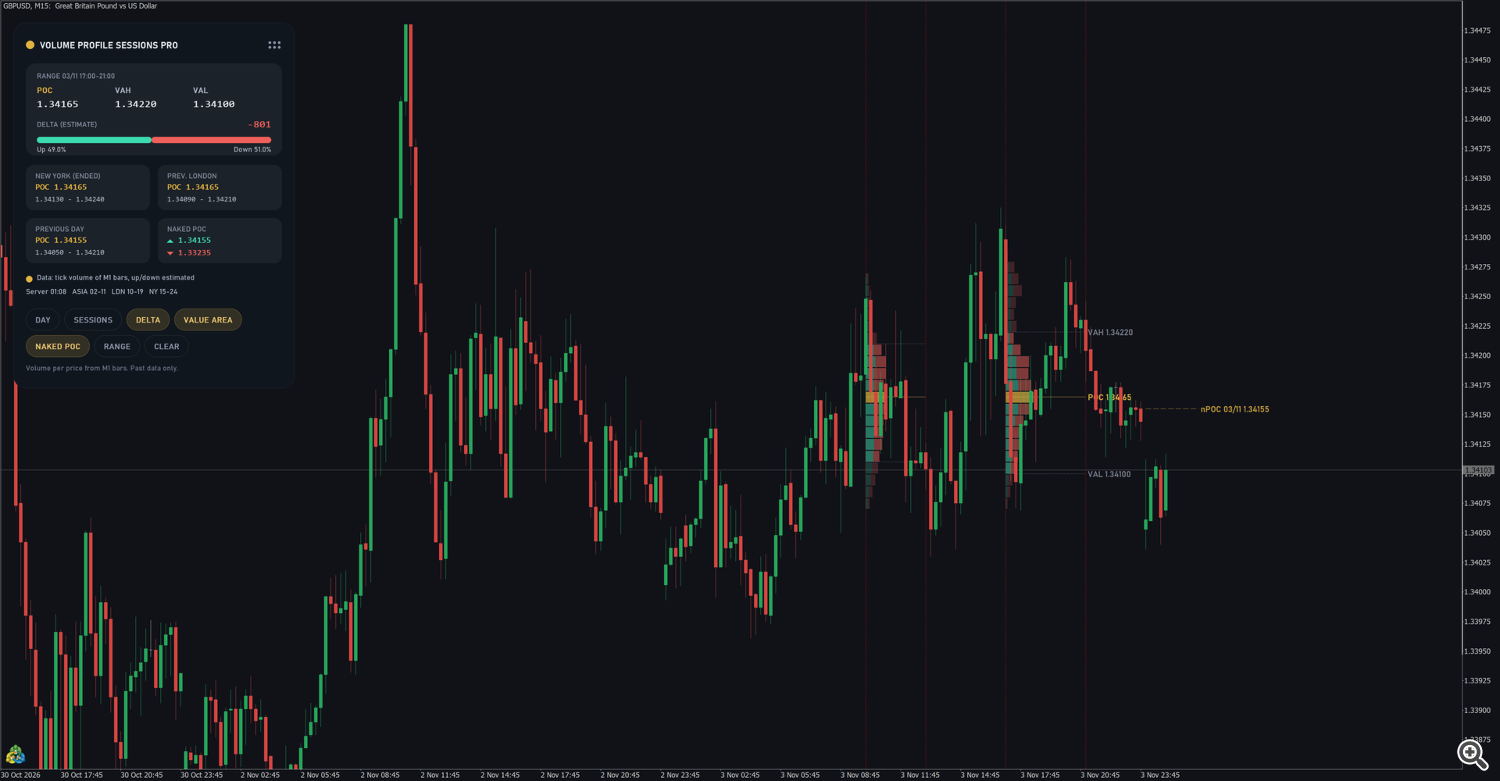
- Press RANGE on the panel. The status line says Click the start of the range on the chart .
- Click the start of the period on the chart, then the end ( Click the end of the range ).
- A dotted rectangle marks the range and its profile is drawn inside it, with the width set by Session profile width.
- A range can cover several days.
- The rectangle can be moved or resized with the mouse; the profile follows. Select it and press Delete to remove one range; CLEAR removes all ranges. Press RANGE again before the second click to cancel.
- Price labels are written only on the most recent range.
- Ranges stay on the chart when you change the timeframe or restart the terminal; they are removed when the indicator is removed from the chart.
- With DAY and SESSIONS both off, only your ranges remain and the panel's first card shows the levels and delta of the latest range.
4.6 Panel and buttons
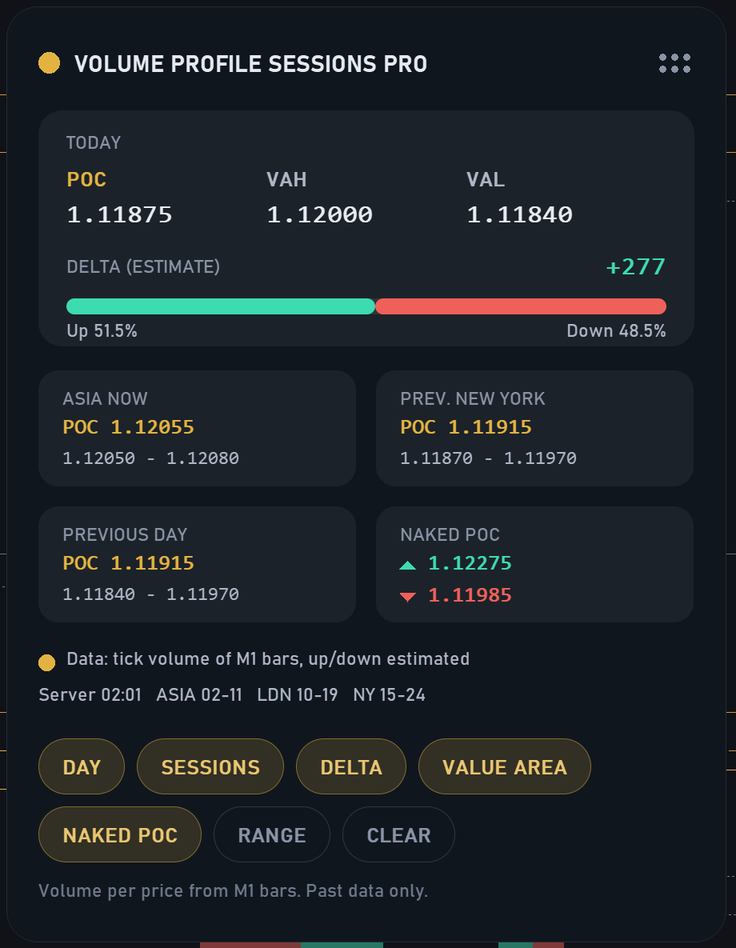
| Panel part | Content |
|---|---|
| TODAY | Developing POC, VAH, VAL of today; DELTA (ESTIMATE) with the up / down share bar (or VOLUME when the split is off). Shows the latest range when DAY and SESSIONS are off. |
| <SESSION> NOW / (ENDED) | POC and value area (VAL – VAH) of the running session, or of the last one when none is running. |
| PREV. <SESSION> | The session before it. |
| PREVIOUS DAY | POC and value area of the previous day. |
| NAKED POC | Nearest naked POC above (▲) and below (▼) the price. |
| Data: tick volume of M1 bars, up/down estimated | Volume source: real volume (green dot) when the feed has it, tick volume (gold dot) otherwise. |
| Server 18:49 ASIA 02-11 LDN 10-19 NY 15-24 | Server time and the hours of the sessions that are on. |
| Button | Action |
|---|---|
| DAY | Daily profiles on / off. |
| SESSIONS | Session profiles on / off (also changes where daily profiles are drawn, section 4.1). |
| DELTA | Up / down colours on / off. |
| VALUE AREA | VAH / VAL lines and the faded rows outside the value area on / off. |
| NAKED POC | Naked POC lines on / off. |
| RANGE | Draw a fixed range (section 4.5). |
| CLEAR | Remove all ranges. |
- Drag the panel by its header to any place on the chart; the position is kept for that chart. Panel X, Panel Y and Panel size (%) set the starting position and the size; Show the panel = false hides it.
- The button states are kept for the chart (timeframe change, terminal restart) and reset when the indicator is removed.
4.7 Data and the Strategy Tester
- The profiles use the volume of 1-minute bars: real volume when the feed has it (stocks, futures), tick volume otherwise (forex, metals, CFDs). Tick volume counts price changes and is the usual activity measure on forex.
- The terminal downloads the 1-minute history by itself; the first calculation waits for it ( Loading M1 history ).
- Only closed data is used for past bars: the footer Past data only reminds you that the buffers of a closed bar are not changed later by newer data.
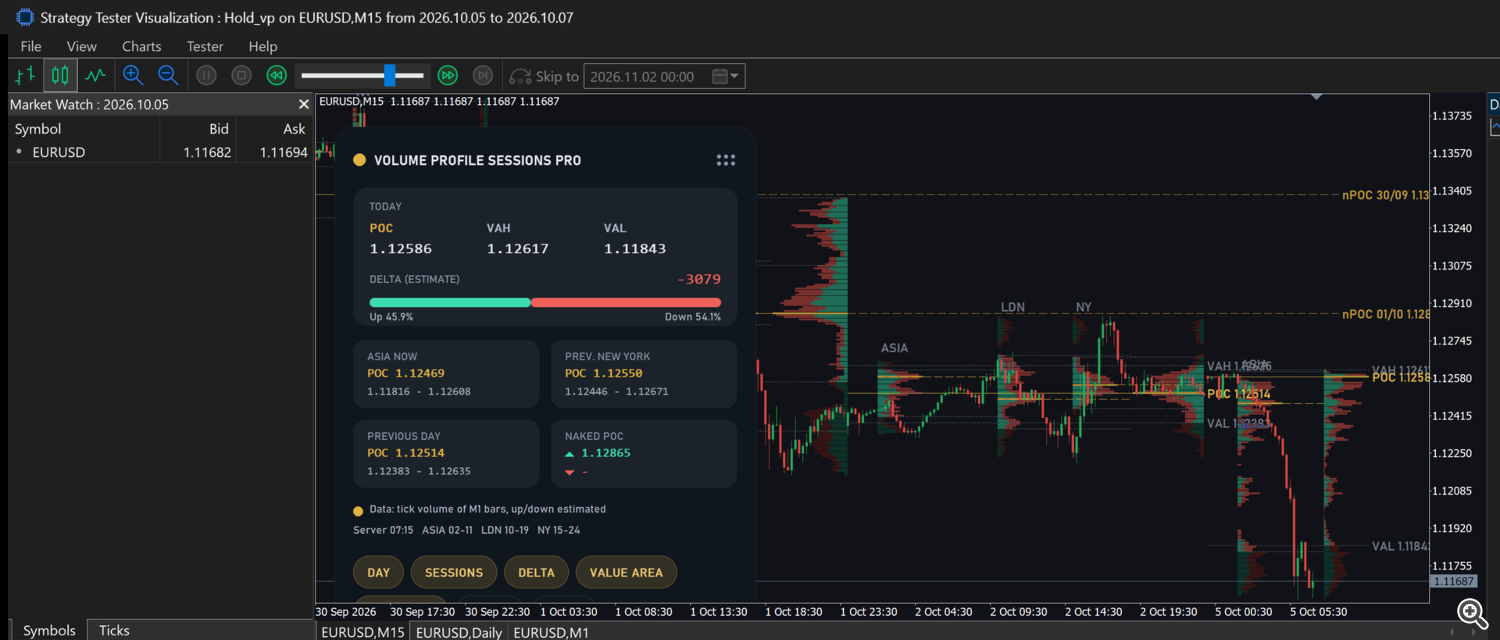
- Strategy Tester: the tester provides 1-minute history before the test start date, so session profiles, previous days and naked POCs are on the chart from the first bar of the test, in visual mode and for Expert Advisors. Nothing to prepare. In a non-visual test only the buffers are calculated. After a visual test the last state stays on the chart. Pop-ups, sounds, notifications and e-mails are not sent in the tester.
5. Volume Profile Delta B3 PRO
5.1 What it draws
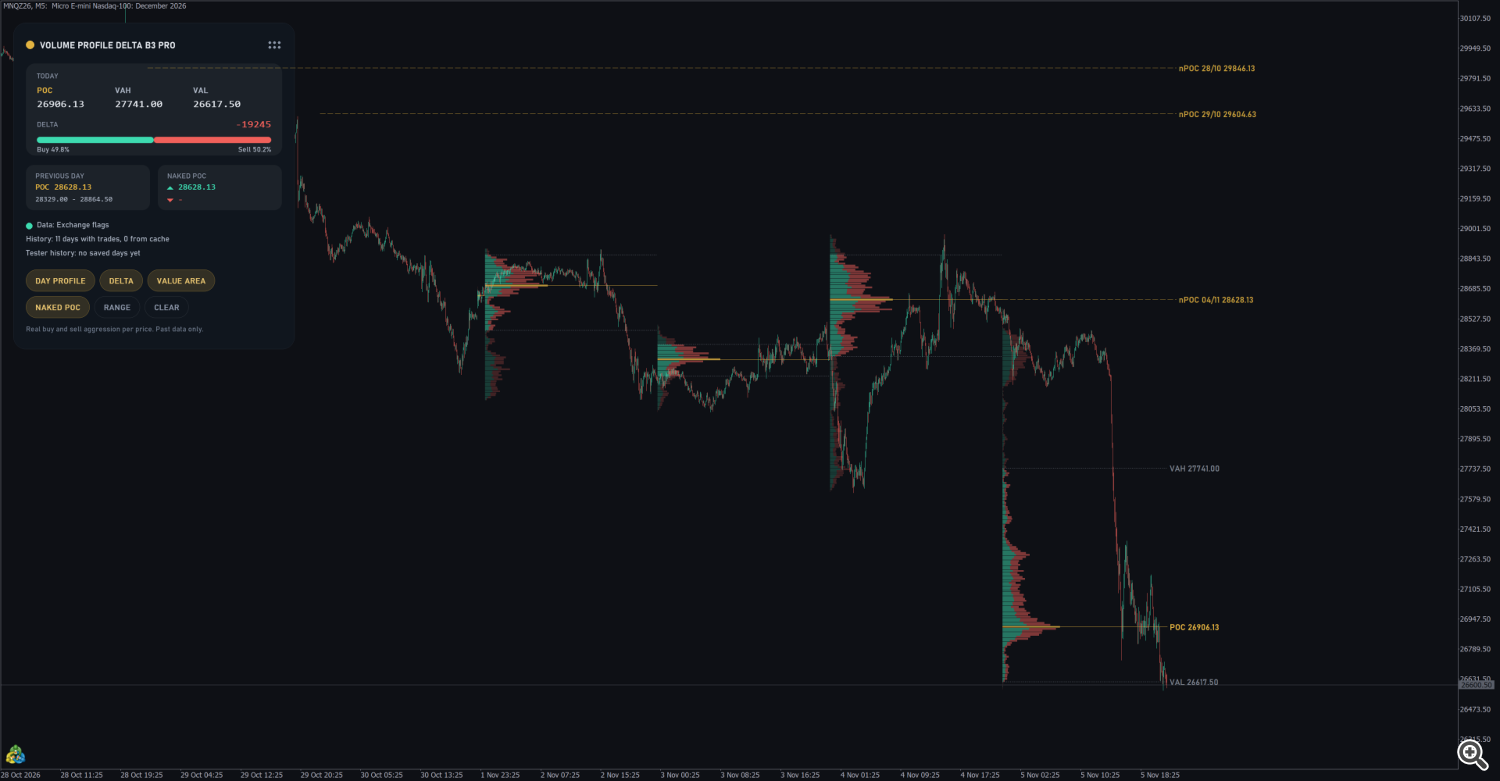
- One profile per day, drawn from the first to the last trade of the day; its width is Profile width (% of the session) of that time. Daily profiles to draw (default 5) sets how many days.
- Each row is split into buy aggression (green, left part) and sell aggression (red, right part) when Split each row into buy and sell and the DELTA button are on. The POC row is gold.
- Today's profile carries the POC / VAH / VAL labels; older days show lines only.
- Naked POCs of the previous days within Days checked for untouched POCs (default 10) are drawn as dashed gold lines labelled nPOC dd/mm price until price trades at them.
- Works on timeframes below D1.
5.2 Real buy and sell aggression
The indicator reads every trade of the day (time and sales) and adds it to the buy side or to the sell side according to who was the aggressor. The Data: line of the panel shows the source in use:
| Data: line | Meaning |
|---|---|
| Exchange flags (green dot) | The feed carries the exchange buy / sell information for each trade. Best case. |
| Price rule (no flags) (gold dot) | The feed has trades without that information; the indicator classifies the trades itself. |
| Generated ticks - not real (red) | Strategy Tester only: the tester replaced the real ticks with generated ones, which carry no aggression. See section 5.5. |
| Saved real trades (tester) | Strategy Tester: the day comes from the saved real trades. |
| Waiting for trades | No trade received yet (market closed or symbol without trades). |
No exchange trades: use B3 futures or shares means the feed of this symbol has no real trades (most forex and CFD feeds). 2 day(s) with incomplete tick history means the broker did not deliver all trades of some days; those days are shown but not saved.
The panel line History: 11 days with trades, 9 from cache tells how many days were found and how many came from the saved files.
5.3 Fixed range profile
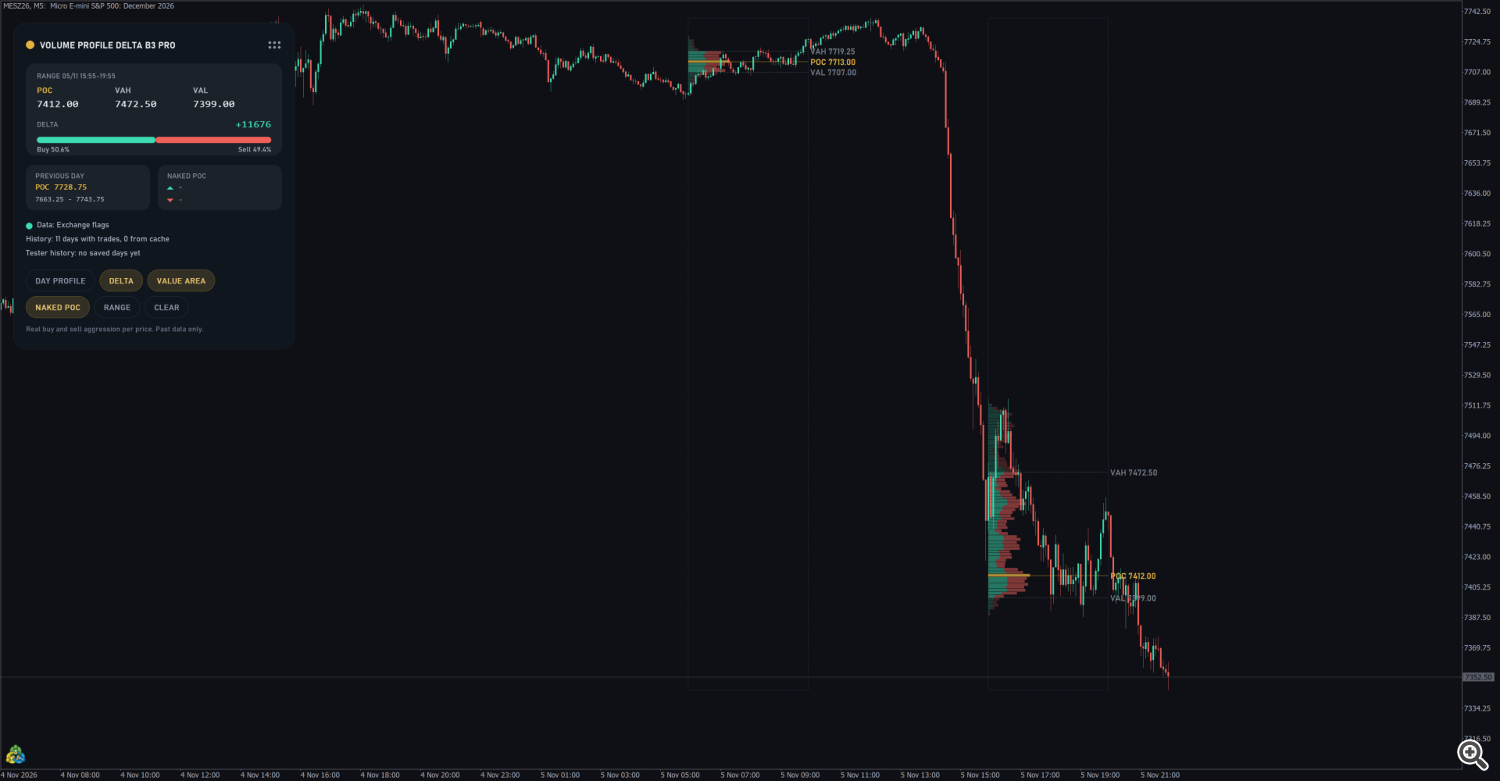
Same steps as in section 4.5: press RANGE, click the start and the end. A range covers one day: if it crosses into the next day, only the part on its first day is used. Ranges can be moved, resized or deleted, and CLEAR removes them all. With DAY PROFILE off, only your ranges remain (naked POC lines are hidden too) and the panel shows the POC, VAH, VAL and delta of the latest range.
5.4 Panel and buttons

| Panel part | Content |
|---|---|
| TODAY | Developing POC, VAH, VAL; DELTA (buy − sell) with the Buy % / Sell % bar. Shows the latest range when DAY PROFILE is off. |
| PREVIOUS DAY | POC and value area (VAL – VAH) of the previous day. |
| NAKED POC | Nearest naked POC above (▲) and below (▼) the price. |
| Data: | Aggression source (section 5.2). |
| History: | Days with trades and days read from the saved files. |
| Status line (gold) | Loading progress, range instructions, missing trades. |
| Tester line | What the Strategy Tester will find (section 5.5). |
Buttons: DAY PROFILE, DELTA, VALUE AREA, NAKED POC, RANGE, CLEAR — same use as in section 4.6. The panel can be dragged by its header; positions and button states are kept for the chart.
5.5 Strategy Tester with real trades
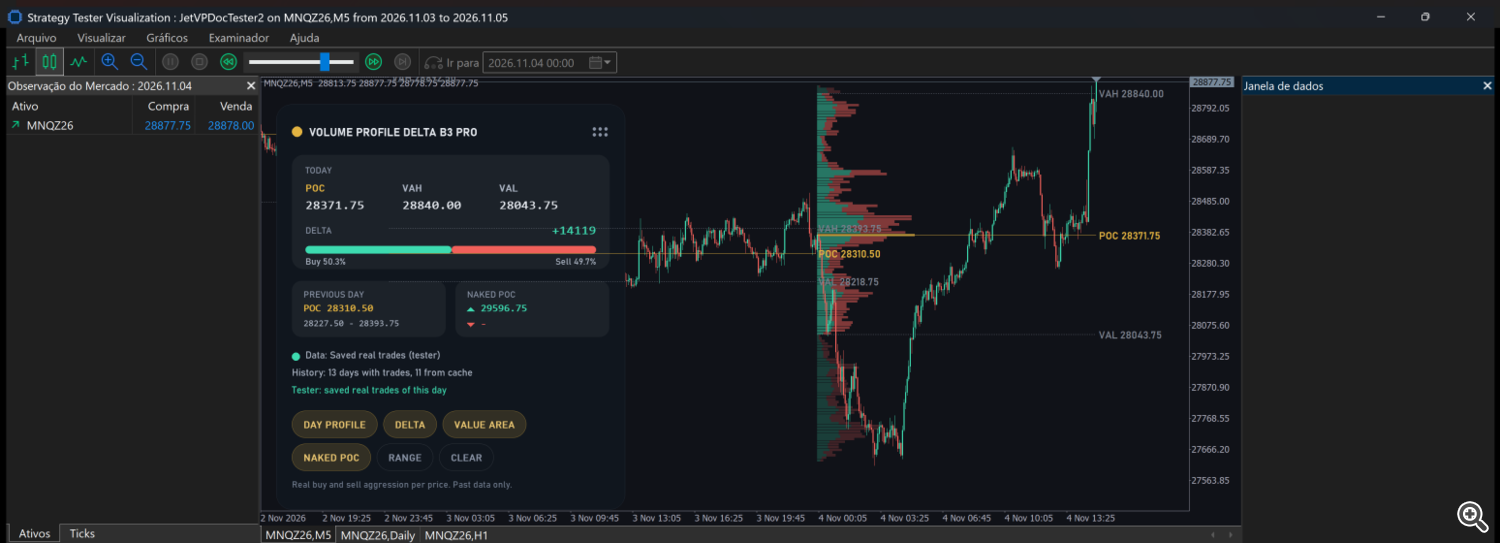
The MetaTrader 5 tester gives no ticks before the test start date and, on B3, it often replaces the real ticks with generated ones, which carry no aggression. The indicator solves this by saving every finished day of real trades on your computer and reading those days in the tester. The trades of each minute are added only after that minute has closed in the test, so nothing from the future is visible.
Days are saved automatically while the indicator runs on a live chart (Save finished days and read them in the tester = true). To prepare a longer period at once:
- On a real or demo account with B3 data, open the chart of the exact contract you will test (for example WINZ26).
- Attach the indicator with Days to prepare for the Strategy Tester = 60 (or the number of days you need) and leave the chart open. The tester line shows Preparing tester history 12 / 60 (14/10) .
- Wait until it shows Tester history ready: 60 days (dd/mm - dd/mm) in green.
- In the Strategy Tester choose the same contract, the model Every tick based on real ticks and a period inside the prepared days.
- Check the tester line on the panel during the test:
| Tester line | Meaning |
|---|---|
| Tester: saved real trades of this day (green) | The day is replayed from the saved real trades. |
| Day not saved: using the tester ticks (gold) | No saved file for this day; the tester ticks are used as they come. |
| Generated ticks: prepare this day on a live chart (red) | The tester generated the ticks of this day; there is no aggression. Prepare the day (step 2). |
| Demo: only trades inside the test period (gold) | The free Market demo runs only in the tester and has no saved days. |
Live, the same line shows the state of the saved history: Tester history: no saved days yet , Tester history: 23 days (...) , or Broker tick history starts after 05/09. Saved ... when the broker keeps no older trades.
Notes:
- Days are saved per contract: WINZ26 and WIN$N are different symbols.
- The files stay in the common folder of the computer that runs the test ( Common\Files\JetAggr ). MQL5 Cloud Network agents cannot see them.
- Only days that the broker still keeps in its tick history can be prepared.
- Previous days, naked POCs and the previous VAH / VAL in the tester come only from saved days.
- Order Flow Book B3 Ultra saves its trades in the same folder, so days recorded by either indicator serve both.
6. Daily Volume Profile (free)

- Draws the profile of today from the first bar of the day, growing to the right; the width is Profile width (% of the day so far). It updates during the day.
- POC (gold), VAH and VAL lines run to the right of the last bar with their price labels; the value area rows are brighter.
- Panel: TODAY with POC, VAH, VAL and the total volume of the day, and the Data: line (real or tick volume of M1 bars). The panel position and size are set by inputs.
- Status messages: Waiting for daily history , Waiting for M1 history , No bars today yet .
- Works in the Strategy Tester. No alerts and no buffers.
Session profiles, previous days, naked POCs, fixed ranges, the up / down split, alerts and buffers are in Volume Profile Sessions PRO.
7. Alerts (PRO editions)

| Input | Fires when | Message (example) |
|---|---|---|
| Alert when price touches a naked POC | price trades at a naked POC | price touched the naked POC LDN 28/10 1.11389 (Sessions PRO) / price touched the naked POC 171000 (Delta B3 PRO) |
| Alert when price crosses the previous day VAH or VAL (Sessions PRO) / ... previous VAH or VAL (Delta B3 PRO) | a closed bar of the chart traded through the previous day's VAH or VAL | price crossed the previous day VAH 1.11546 |
The message starts with the product, the symbol and the timeframe, for example Volume Profile Sessions PRO: EURUSD | M15 | ... .
- Alert: Off, Popup, Sound, Smartphone notification, Popup + Sound (default), Notification + Sound, Popup + Notification, Popup + Sound + Notification. Sound: one of 13 terminal sounds (default alert2).
- Also send e-mail: sends each alert by e-mail as well (needs Tools → Options → Email). The e-mail is sent even when Alert is Off.
- The VAH / VAL alert is checked when a bar of the chart closes, so the timeframe sets how quickly it comes. Each level alerts at most once per bar.
- Sessions PRO checks naked POC touches continuously; Delta B3 PRO checks them at the close of each chart bar and only while the naked POC lines are shown (DAY PROFILE and NAKED POC on). A naked POC alerts once: after the touch it is no longer naked.
- Push notifications need the MetaQuotes ID in Tools → Options → Notifications. Alerts are not sent in the Strategy Tester.
8. Inputs
The headings are the input groups of the Inputs tab.
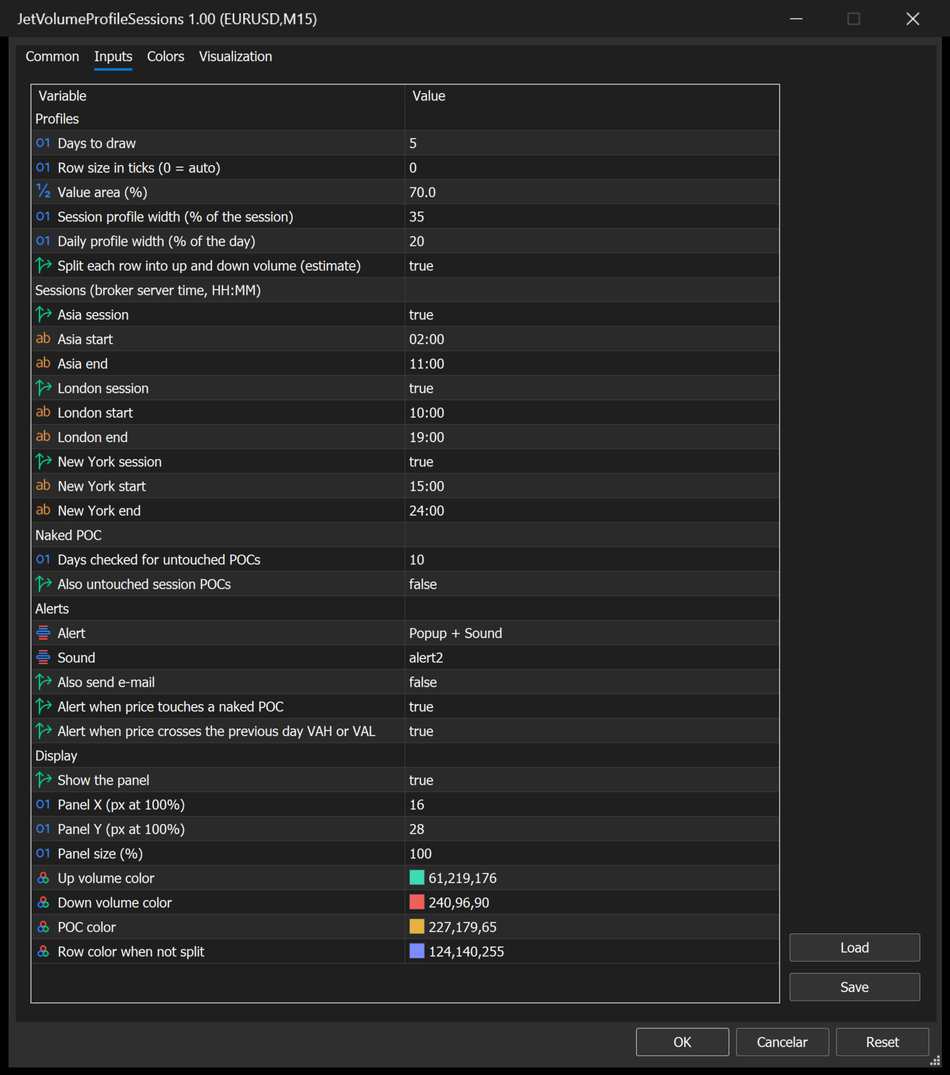
8.1 Volume Profile Sessions PRO
Profiles
| Input | Default | Description |
|---|---|---|
| Days to draw | 5 | Days with profiles on the chart. Keep it below 30. |
| Row size in ticks (0 = auto) | 0 | Price height of each row. 0 chooses a size that suits the symbol; a larger number gives fewer, thicker rows. |
| Value area (%) | 70 | Share of the volume inside VAH – VAL. |
| Session profile width (% of the session) | 35 | Length of the longest row of a session profile; also used for ranges and for daily profiles when SESSIONS is off. |
| Daily profile width (% of the day) | 20 | Length of the longest row of a daily profile when SESSIONS is on. |
| Split each row into up and down volume (estimate) | true | Green / red split and DELTA (ESTIMATE) on the panel; false = one colour and VOLUME on the panel. |
Sessions (broker server time, HH:MM)
| Input | Default | Description |
|---|---|---|
| Asia session | true | Asia profiles on / off. |
| Asia start / Asia end | 02:00 / 11:00 | Asia hours in server time. |
| London session | true | London profiles on / off. |
| London start / London end | 10:00 / 19:00 | London hours in server time. |
| New York session | true | New York profiles on / off. |
| New York start / New York end | 15:00 / 24:00 | New York hours in server time. |
Naked POC
| Input | Default | Description |
|---|---|---|
| Days checked for untouched POCs | 10 | How far back naked POCs are searched. Keep it below 30. |
| Also untouched session POCs | false | Adds session POCs to the naked POCs. |
Alerts
| Input | Default | Description |
|---|---|---|
| Alert | Popup + Sound | Alert mode (section 7). |
| Sound | alert2 | Sound file of the alert. |
| Also send e-mail | false | E-mail for each alert. |
| Alert when price touches a naked POC | true | Naked POC alert. |
| Alert when price crosses the previous day VAH or VAL | true | VAH / VAL alert. |
Display
| Input | Default | Description |
|---|---|---|
| Show the panel | true | Panel on / off. |
| Panel X (px at 100%) / Panel Y (px at 100%) | 16 / 28 | Starting position of the panel. |
| Panel size (%) | 100 | Panel scale. |
| Up volume color | green (61,219,176) | Up part of the rows and positive delta. |
| Down volume color | red (240,96,90) | Down part of the rows and negative delta. |
| POC color | gold (227,179,65) | POC rows, POC lines and naked POCs. |
| Row color when not split | blue (124,140,255) | Rows when the split is off; range rectangles. |
8.2 Volume Profile Delta B3 PRO
Profiles
| Input | Default | Description |
|---|---|---|
| Daily profiles to draw | 5 | Days with profiles on the chart. |
| Row size in ticks (0 = auto) | 0 | Price height of each row; 0 = automatic. |
| Value area (%) | 70 | Share of the volume inside VAH – VAL. |
| Profile width (% of the session) | 35 | Length of the longest row, as a share of the day's trading time (or of the range). |
| Split each row into buy and sell | true | Green / red split of the rows; the panel always shows the delta. |
Naked POC
| Input | Default | Description |
|---|---|---|
| Days checked for untouched POCs | 10 | How far back naked POCs are searched. |
History for the Strategy Tester
| Input | Default | Description |
|---|---|---|
| Save finished days and read them in the tester | true | Saves the real trades of finished days on this computer and uses them in the tester (section 5.5). |
| Days to prepare for the Strategy Tester (0 = off) | 0 | On a live chart, downloads and saves this many past days in the background. |
Alerts — same as Sessions PRO (Alert Popup + Sound, Sound alert2, Also send e-mail false, Alert when price touches a naked POC true, Alert when price crosses the previous VAH or VAL true).
Display — Show the panel, Panel X / Y, Panel size (%) as in Sessions PRO; Buy aggression color (green), Sell aggression color (red), POC color (gold), Row color when not split (blue).
8.3 Daily Volume Profile
| Input | Default | Description |
|---|---|---|
| Row size in ticks (0 = auto) | 0 | Price height of each row; 0 = automatic. |
| Value area (%) | 70 | Share of the volume inside VAH – VAL. |
| Profile width (% of the day so far) | 35 | Length of the longest row. |
| Show the panel | true | Panel on / off. |
| Panel X / Panel Y (px at 100%) | 16 / 28 | Panel position. |
| Panel size (%) | 100 | Panel scale. |
| Profile color | blue (124,140,255) | Rows. |
| POC color | gold (227,179,65) | POC row, line and label. |
9. Buffers for Expert Advisors
The two PRO editions expose buffers that can be read with iCustom + CopyBuffer , also in the Strategy Tester. They draw nothing and are listed in the Data Window. The Daily Volume Profile has no buffers.
9.1 Volume Profile Sessions PRO (13 buffers)
| Buffer | Name in the Data Window | Value on each bar | Empty |
|---|---|---|---|
| 0 | Developing day POC | today's POC as it was at the close of that bar | EMPTY_VALUE |
| 1 | Developing day VAH | today's VAH at the close of that bar | EMPTY_VALUE |
| 2 | Developing day VAL | today's VAL at the close of that bar | EMPTY_VALUE |
| 3 | Bar up volume (est.) | up volume of the bar (estimate) | 0 |
| 4 | Bar down volume (est.) | down volume of the bar (estimate) | 0 |
| 5 | Bar delta (est.) | buffer 3 − buffer 4 | 0 |
| 6 | Day delta (est.) | delta of the day from its start up to that bar | 0 |
| 7 | Previous day POC | POC of the previous day | EMPTY_VALUE |
| 8 | Previous day VAH | VAH of the previous day | EMPTY_VALUE |
| 9 | Previous day VAL | VAL of the previous day | EMPTY_VALUE |
| 10 | Session POC | developing POC of the session running at that bar (the later one when two overlap) | EMPTY_VALUE outside sessions |
| 11 | Session VAH | VAH of that session | EMPTY_VALUE |
| 12 | Session VAL | VAL of that session | EMPTY_VALUE |
With Split each row into up and down volume = false, buffers 3 and 4 hold half of the bar volume each and buffers 5 and 6 are 0.
9.2 Volume Profile Delta B3 PRO (10 buffers)
| Buffer | Name in the Data Window | Value on each bar | Empty |
|---|---|---|---|
| 0 | Developing POC | today's POC as it was at the close of that bar | EMPTY_VALUE |
| 1 | Developing VAH | today's VAH at the close of that bar | EMPTY_VALUE |
| 2 | Developing VAL | today's VAL at the close of that bar | EMPTY_VALUE |
| 3 | Bar buy volume | buy aggression volume of the bar | 0 |
| 4 | Bar sell volume | sell aggression volume of the bar | 0 |
| 5 | Bar delta | buffer 3 − buffer 4 | 0 |
| 6 | Day delta | delta of the day from its start up to that bar | 0 |
| 7 | Previous POC | POC of the previous day | EMPTY_VALUE |
| 8 | Previous VAH | VAH of the previous day | EMPTY_VALUE |
| 9 | Previous VAL | VAL of the previous day | EMPTY_VALUE |
9.3 Notes for both
- Bar 0 (the forming bar) is updated during the bar; read shift 1 for values that no longer change.
- Bars older than the days the indicator loaded hold the empty value.
- Wait until BarsCalculated(h) > 0 before the first read; the first calculation waits for the history.
- The Market version is installed in MQL5\Indicators\Market\ ; check the exact file name in the Navigator. With no parameters after the name the default inputs are used. To change inputs, pass them in the order of section 8; the group headings are not parameters. Alert modes are passed as numbers: 0 Off, 1 Popup, 2 Sound, 3 Notification, 4 Popup + Sound, 5 Notification + Sound, 6 Popup + Notification, 7 all three.
- An indicator created by iCustom also draws its profiles and panel on the chart of the calling program. Pass Show the panel = false if you do not need the panel. Use one copy per chart: two copies of the same indicator on one chart share object names and overwrite each other's drawing.
// Volume Profile Sessions PRO with default inputs
int h = iCustom(_Symbol, PERIOD_M15, "Market\\Volume Profile Sessions PRO");

double poc[1], pvah[1], pval[1], dd[1];
if (h != INVALID_HANDLE && BarsCalculated(h) > 0)
{
    if (CopyBuffer(h, 0, 1, 1, poc) == 1 && poc[0] != EMPTY_VALUE)
        Print("developing POC at the last closed bar: ", poc[0]);
    if (CopyBuffer(h, 8, 1, 1, pvah) == 1 && CopyBuffer(h, 9, 1, 1, pval) == 1 && pvah[0] != EMPTY_VALUE)
        Print("previous day value area ", pval[0], " - ", pvah[0]);
    if (CopyBuffer(h, 6, 1, 1, dd) == 1)
        Print("day delta (estimate) ", dd[0]);
}
// Volume Profile Delta B3 PRO: 10 days, row size auto, value area 70%, no panel
// (inputs in the order of section 8.2; alert mode 0 = Off)
int h = iCustom(_Symbol, PERIOD_M5, "Market\\Volume Profile Delta B3 PRO",
                10, 0, 70.0, 35, true,      // Profiles
                10,                         // Naked POC
                true, 0,                    // History for the Strategy Tester
                0, 0, false, true, true,    // Alerts
                false);                     // Show the panel = false
double delta[1];
if (BarsCalculated(h) > 0 && CopyBuffer(h, 5, 1, 1, delta) == 1)
    Print("bar delta of the last closed bar: ", delta[0]);
10. Tips
- Session hours first. On Sessions PRO, compare the Server time on the panel with your broker's server time and adjust the six session inputs once. Save them with the chart template.
- Timeframe. M5 to M30 show session profiles well; M1 makes them very long, H1 very short. Delta B3 PRO works best from M1 to M15 on intraday futures.
- Less clutter. Turn off VALUE AREA or DELTA with the buttons; lower Days to draw; switch SESSIONS off to keep only daily profiles.
- Thicker rows. Set Row size in ticks to a number above 0 when the automatic rows look too thin for your zoom; raise it step by step until the profile reads well.
- Previous day levels. VAH / VAL of the previous day and the nearest naked POCs are on the panel; there is no need to keep old profiles visible.
- Tester on B3. Prepare the days once (section 5.5) and keep the chart of the contract open during the session: each finished day is saved automatically.
- Light charts. All drawings follow the chart background; change the background and the indicator redraws with the right contrast.
11. Questions and troubleshooting
- Does it repaint? Past bars are built from closed data only. A profile and its POC / VAH / VAL grow while their period (day, session, range) is running and are final when it ends. The values of the forming bar in the buffers change until the bar closes.
- Sessions are in the wrong place (Sessions PRO). The session inputs are in broker server time. Check the Server time on the panel and move the hours (section 4.2).
- The up / down split is not real aggression (Sessions PRO). Correct: it is an estimate from 1-minute bars. For real aggression on B3, use Volume Profile Delta B3 PRO.
- No exchange trades (Delta B3 PRO). The symbol's feed has no real trades. Use B3 futures or shares on a broker that delivers B3 market data.
- Data: Price rule (no flags) . Your feed sends trades without the exchange buy / sell information; the indicator classifies them itself. The profile still works.
- The tester shows no previous days (Delta B3 PRO). Those days were not saved. Prepare them on a live chart (section 5.5) for the exact contract you test.
- The tester line is red: Generated ticks . The tester generated the ticks of that day. Use Every tick based on real ticks and a prepared day.
- The panel hides the candles. Drag it by its header, lower Panel size (%), or set Show the panel = false.
- A range does not appear. Press RANGE, then click twice on the chart (not on the panel). On Delta B3 PRO the range must start on a day that has trades.
- Strategy Tester. Sessions PRO and Daily VP need no preparation. In a non-visual test only the buffers are calculated. Alerts are not sent in the tester.
Support: send a private message on MQL5 to the author.