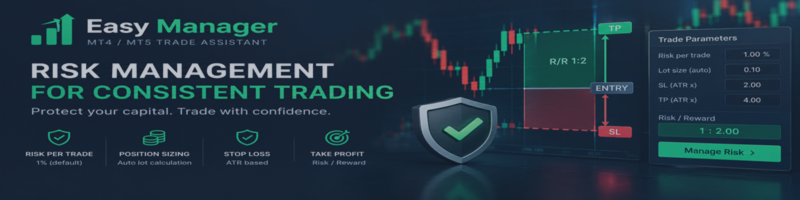

Easy Manager is a chart-based trading assistant designed to make trade execution, risk assessment, position management, and technical analysis easier to manage from one interface.
Instead of switching between multiple Metatrader windows, traders can access essential tools directly from the chart. The interface combines an ATR-based Position Opener, a visual Trade Planner, an account information panel, Market Watch, manual High/Low drawing tools, and automatic swing-level detection.
Easy Manager focuses on a straightforward workflow: plan a trade, evaluate the risk, execute when ready, and manage positions directly from the chart.
1. Position OpenerThe Position Opener is the main trade execution panel. It allows you to open Buy and Sell positions, adjust the lot size, calculate risk, and manage existing positions.
Buy and Sell
The Buy and Sell buttons allow you to open a market position on the currently selected chart symbol.
-
BUY: Opens a long position.
-
SELL: Opens a short position.
The order uses the current market price and the configured trade settings. Always verify the symbol, lot size, and calculated risk before placing an order.
Lot Size
The lot-size control determines the trading volume used for new positions.
The default lot size is 0.01 lots, and the interface allows you to increase or decrease the volume using the lot controls.
A larger lot size increases the financial impact of a given price movement. Your risk therefore depends on the lot size, the distance to the Stop Loss, and the instrument being traded.
ATR-Based Position Entry
Easy Manager uses the Average True Range (ATR) to calculate a price distance for the Position Opener.
ATR measures recent market volatility. It accounts for the range of price movements, including gaps, and can help adapt a trade setup to changing market conditions.
The Position Opener includes controls for adjusting the ATR multiplier. The upper and lower ATR levels are displayed as horizontal lines when the panel is expanded.
These levels help visualize the price distance used by the tool. They are not, by themselves, guaranteed support or resistance levels.
Position Opener settings
| Setting | Default | Purpose |
|---|---|---|
| ATRPeriod | 14 | Number of periods used to calculate ATR. |
| ATRTimeframe | Current timeframe | Timeframe used for the Position Opener's ATR calculation. |
| DefaultATRMultiplier | 2.00 | Initial ATR multiplier used to calculate the price distance. |
| ATRMultiplierStep | 0.50 | Increment applied when adjusting the multiplier with the panel controls. |
| UpperLineColor | Tomato | Color of the upper ATR line. |
| LowerLineColor | Tomato | Color of the lower ATR line. |
| LineWidth | 1 | Width of the ATR lines. |
| LineStyle | Dash-dot | Visual style of the ATR lines. |
How to adjust ATR settings
For a more responsive volatility measurement: Try a shorter ATR period. It will generally react more quickly to recent price changes.
For a smoother volatility measurement: Try a longer ATR period. This incorporates more historical price movement.
For wider price distances: Increase the ATR multiplier.
For narrower price distances: Decrease the ATR multiplier.
For example, with ATR equal to 20 points and a multiplier of 2.00, the calculated distance is 40 points. The actual price distance depends on the instrument's price scale and the ATR value returned by Metatrader.
Risk Display
The Position Opener displays risk information based on the trade setup and account balance. This helps you assess the potential financial exposure before opening a position.
Remember that a calculated risk amount is an estimate. Execution price, slippage, commissions, swaps, and gaps can cause the final result to differ from the estimate.
Close, Sync Stop Loss, and Trailing Stop Loss
The Position Opener includes additional controls for managing positions.
-
CLOSE: Closes positions through the position management controls.
-
SYNC STOPLOSS: Synchronizes Stop Loss levels across applicable positions.
-
TRAIL STOPLOSS: Activates or deactivates the trailing Stop Loss function.
-
Minimize: Collapses the panel to save chart space.
The exact positions affected by a management action depend on the EA's implementation and applicable trade filters. Check the account's open positions after using these controls.
The Trade Planner is designed to help you evaluate a potential trade visually before committing real money.
You can define an Entry price, Stop Loss, and Take Profit directly on the chart. The tool displays the proposed trade structure and calculates the associated risk and reward.
Planning a Trade
-
Open the Trade Planner.
-
Start a new trade plan.
-
Select Buy or Sell.
-
Adjust the planned Entry, Stop Loss, and Take Profit.
-
Review the displayed risk, potential reward, and Risk/Reward ratio.
-
Execute the planned order if the setup meets your trading criteria, or cancel the plan.
The Entry, Stop Loss, and Take Profit lines can be adjusted directly on the chart. This makes it easier to see how changing a price level affects the proposed trade.
Buy and Sell Direction
The direction determines how the Entry, Stop Loss, and Take Profit levels are arranged.
For a Buy setup, the Stop Loss is below the Entry and the Take Profit is above it.
For a Sell setup, the Stop Loss is above the Entry and the Take Profit is below it.
The planner helps maintain this directional relationship when the trade direction changes.
Risk, Reward, and Risk/Reward Ratio
The Trade Planner displays the estimated monetary risk, risk as a percentage of account balance, potential reward, and Risk/Reward ratio.
For example, a setup with a potential loss of $100 and a potential profit of $200 has a planned Risk/Reward ratio of 1:2.
A higher potential reward relative to risk does not automatically make a trade profitable. The probability of reaching the target and the quality of the setup also matter.
ATR-Based Paper Trade Levels
The Trade Planner can calculate its initial planned Stop Loss and Take Profit distances using ATR.
These settings are separate from the ATR settings in the Position Opener.
| Setting | Default | Purpose |
|---|---|---|
| PaperATRTimeframe | Current timeframe | Timeframe used for the Trade Planner's ATR calculation. |
| PaperATRPeriod | 14 | ATR calculation period for the Trade Planner. |
| PaperSL_ATR | 2.00 | ATR multiplier used for the planned Stop Loss distance. |
| PaperTP_ATR | 4.00 | ATR multiplier used for the planned Take Profit distance. |
Example
If ATR is 20 points:
-
A Stop Loss multiplier of 2.00 corresponds to a distance of 40 points.
-
A Take Profit multiplier of 4.00 corresponds to a distance of 80 points.
This produces a planned distance ratio of 1:2, assuming both levels use the same ATR value and are calculated from the same Entry price.
The planned levels can then be reviewed and adjusted on the chart.
Visual Trade Areas
The planner uses colored rectangles to distinguish the risk area from the potential reward area.
| Setting | Default | Purpose |
|---|---|---|
| PaperSLAreaColor | Dark red | Color of the Stop Loss area. |
| PaperTPAreaColor | Dark green | Color of the Take Profit area. |
| PaperRectangleBars | 25 | Horizontal rectangle length, measured in chart bars. |
| PaperRectangleShiftBars | 3 | Horizontal offset of the rectangles in chart bars. |
The rectangles make it easier to see the relative size of the planned risk and reward areas.
Trade Planner Line Appearance
| Setting | Default | Purpose |
|---|---|---|
| PaperLineColor | Dark gray | Color of the planner's lines. |
| PaperLineWidth | 1 | Width of the lines. |
| PaperLineStyle | Dash-dot | Line style. |
These settings change the visual appearance of the planning objects rather than the trade's financial risk.
Trade Planner Buttons
-
NEW TRADE: Starts a new trade plan.
-
BUY / SELL: Selects the planned direction.
-
Lot controls: Adjust the planned trading volume.
-
SEND / ORDER: Submits the planned order through the EA's execution logic.
-
CANCEL: Cancels the active planning operation.
-
DELETE ORDERS: Removes applicable pending orders.
-
CLOSE ALL: Closes applicable positions for the current symbol.
The planner's visual Entry, Stop Loss, and Take Profit levels should not be confused with a broker-side order. A planned setup is not a live trade until it has been submitted successfully.
The Info Panel provides an overview of the account and its trading activity.
It is designed to make important information available without requiring you to navigate through multiple Metatrader windows.
Depending on the information available in the account and the EA's calculations, the panel includes metrics such as:
-
Account balance.
-
Free margin.
-
Open-position risk.
-
Risk as money and as a percentage of balance.
-
Symbol-level and total risk information.
-
Closed Today statistics.
Understanding the Information
Balance is the account balance recorded by the trading platform.
Free Margin represents the funds currently available after accounting for margin requirements.
Risk estimates the potential loss associated with applicable open positions and their Stop Loss levels.
Closed Today summarizes closed-trade results for the current day according to the EA's calculation logic.
Risk calculations may be unavailable for some positions if the required Stop Loss or market information is missing. An unavailable risk value should not be interpreted as zero risk.
The Info Panel is primarily informational. It does not guarantee that a trade will remain within a specified risk amount.
The Market Watch panel brings the symbols from MetaTrader's Market Watch window into Easy Manager's chart interface.
This allows you to switch between instruments without repeatedly navigating through the standard symbol list.
How It Works
-
Add the instruments you want to monitor to Metatrader's Market Watch.
-
Arrange the symbols in your preferred order in the Market Watch window.
-
Use Easy Manager's Market Watch panel to select a symbol.
-
The selected symbol opens in the chart.
The panel follows the symbol order defined in Metatrader's own Market Watch.
Market Watch setting
| Setting | Default | Purpose |
|---|---|---|
| MarketWatchMaxSymbols | 33 | Maximum number of symbols displayed by the panel. |
If you monitor only a small number of instruments, a lower maximum can keep the interface more compact. A higher value is useful when you want to switch between a larger watchlist.
The High/Low drawing tool allows you to mark important candle prices directly on the chart.
You can use it to highlight a candle's high or low, identify price levels for further analysis, and create visual references without manually positioning every line.
The tool includes separate settings for high lines, low lines, horizontal rays, and price labels.
Enable or Disable the Tool
| Setting | Default | Purpose |
|---|---|---|
| HL_Enable | True | Enables or disables the High/Low drawing tool. |
High Line Settings
| Setting | Default | Purpose |
|---|---|---|
| HL_HighLineColor | clrNONE | Color of the high-line layer. |
| HL_HighLineStyle | Solid | Style of the high line. |
| HL_HighLineWidth | 1 | Width of the high line. |
Low Line Settings
| Setting | Default | Purpose |
|---|---|---|
| HL_LowLineColor | clrNONE | Color of the low-line layer. |
| HL_LowLineStyle | Solid | Style of the low line. |
| HL_LowLineWidth | 1 | Width of the low line. |
The default clrNONE values mean the corresponding line layer is not assigned a visible color by default. Assign a color when you want that layer to be visible.
High and Low Rays
Rays extend a marked price level horizontally into the future portion of the chart.
| Setting | Default | Purpose |
|---|---|---|
| HL_HighRayColor | Lime | Color of high-price rays. |
| HL_LowRayColor | Tomato | Color of low-price rays. |
Different colors help distinguish upper and lower price levels.
Price Labels
Price labels display the marked high or low price on the chart.
| Setting | Default | Purpose |
|---|---|---|
| HL_ShowHighPriceLabel | True | Enables high-price labels. |
| HL_HighLabelColor | Lime | High-label text color. |
| HL_HighLabelFontSize | 9 | High-label font size. |
| HL_ShowLowPriceLabel | True | Enables low-price labels. |
| HL_LowLabelColor | Tomato | Low-label text color. |
| HL_LowLabelFontSize | 9 | Low-label font size. |
You can disable either label type independently. This is useful when you want to retain the lines but reduce text on the chart.
Historical and Line-Length Settings
| Setting | Default | Purpose |
|---|---|---|
| HL_BarsBack | 0 | Controls the bar offset used by the drawing tool. |
| HL_HistoryBars | 500 | Historical bar range used by the drawing logic. |
| HL_LineLengthBars | 1 | Controls the line-length setting in chart bars. |
These settings influence how the tool works with historical candles and line placement. Their exact visual effect depends on the selected drawing operation.
Practical Example
To create a clean chart for support and resistance analysis:
-
Enable the High/Low drawing tool.
-
Assign distinct colors to the high and low layers.
-
Enable price labels if you need exact prices displayed.
-
Reduce label font sizes if the chart becomes crowded.
-
Adjust the historical range to suit your chart and analysis.
The drawing tool is intended to complement your analysis, not replace the need to assess the broader market structure.
Auto Swing Levels automatically identifies confirmed swing highs and swing lows and draws horizontal price levels on the chart.
Instead of marking every turning point manually, you can let Easy Manager identify local highs and lows using its built-in swing detection logic.
This feature complements the manual High/Low drawing tool: the manual tool allows you to mark selected candle prices, while Auto Swing Levels identifies potential turning points automatically.
Swing High
A Swing High is a local price peak that is higher than the surrounding candles within the swing detection range.
It may indicate a price area where buying pressure previously weakened or selling pressure increased.
A confirmed Swing High can become a potential resistance reference.
Swing Low
A Swing Low is a local price trough that is lower than the surrounding candles within the swing detection range.
It may indicate a price area where selling pressure previously weakened or buying pressure increased.
A confirmed Swing Low can become a potential support reference.
These are potential support and resistance levels, not guaranteed reversal points.
How Confirmation Works
Easy Manager waits for the required number of newer candles to close before accepting a swing point.
This reduces the chance of drawing a level from a turning point that is still developing.
The confirmation process means that a swing level appears with a delay: the EA must wait for sufficient price information before treating the point as confirmed.
Auto Swing Levels Settings
| Setting | Default | Purpose |
|---|---|---|
| ASL_Enable | False | Enables or disables automatic swing-level drawing. |
| ASL_Timeframe | Current timeframe | Timeframe used to identify swing points. |
| ASL_Depth | 12 | Number of newer candles required to confirm a candidate swing point. |
| ASL_MinSwingDistancePoints | 5 | Minimum price distance used to filter nearby swing levels. |
| ASL_HistoryBars | 1000 | Number of historical bars examined by the swing detection logic. |
| ASL_MaxLevels | 10 | Maximum number of displayed swing highs and maximum number of displayed swing lows. |
| ASL_ShowSwingHighs | True | Enables Swing High levels. |
| ASL_ShowSwingLows | True | Enables Swing Low levels. |
| ASL_HighColor | Lime | Color of Swing High levels. |
| ASL_LowColor | Tomato | Color of Swing Low levels. |
| ASL_LineStyle | Solid | Style of the horizontal swing lines. |
| ASL_LineWidth | 1 | Width of the swing lines. |
ASL_Enable
Set this to true to activate automatic swing-level drawing.
When disabled, Easy Manager removes the objects belonging to its Auto Swing Levels feature. This is separate from the manual High/Low drawing layers.
ASL_Timeframe
Select the timeframe used for swing detection.
For example, you can analyze H1 swing levels while viewing another chart timeframe. This can help you monitor larger price structures without changing the chart you are currently using.
ASL_Depth
Depth controls the confirmation window and the sensitivity of swing detection.
A larger value requires more newer candles to close before a swing is confirmed. It generally produces fewer, more established swing points, but the confirmation delay increases.
A smaller value confirms swing points sooner and may identify more local turns.
For example, with Depth set to 12, the EA waits for the required 12 newer candles to close before accepting the candidate swing.
ASL_MinSwingDistancePoints
This setting filters swing levels that are too close together.
A larger minimum distance filters more nearby levels and can create a cleaner chart. A smaller value allows more closely spaced levels to be displayed.
The setting is measured in the symbol's platform points, not necessarily conventional Forex pips. The relationship between points and pips depends on the instrument's price precision.
ASL_HistoryBars
This setting determines how much historical price data is examined for swing points.
A larger value allows the EA to search a longer historical range. A smaller value focuses on more recent price action.
The available history also depends on the price data loaded by Metatrader.
ASL_MaxLevels
This setting controls the maximum number of displayed levels for each swing type.
For example, a value of 10 permits up to 10 Swing High levels and up to 10 Swing Low levels, subject to the available confirmed points and other filters.
Reduce this value if the chart contains too many levels. Increase it if you want to examine more historical turning points.
ASL_ShowSwingHighs and ASL_ShowSwingLows
These switches control the two swing types independently.
-
Set ASL_ShowSwingHighs to true to display upper swing levels.
-
Set ASL_ShowSwingLows to true to display lower swing levels.
You can display both for a complete market-structure view or show only one type when focusing on a particular analysis.
ASL_HighColor and ASL_LowColor
Use separate colors to distinguish potential resistance levels from potential support levels.
For example, lime for Swing Highs and tomato for Swing Lows makes the two types easy to identify visually.
ASL_LineStyle and ASL_LineWidth
These settings adjust the appearance of the horizontal swing lines. They do not change the swing detection logic.
Recommended Starting Configurations
The following are starting points for experimentation, not optimized or guaranteed settings.
For a cleaner chart with broader swings:
-
Use a higher Depth.
-
Increase the minimum swing distance if too many nearby levels appear.
-
Keep Max Swing Levels relatively low.
-
Display both swing highs and swing lows.
For more detailed local price analysis:
-
Use a lower Depth.
-
Reduce the minimum swing distance if appropriate for the instrument.
-
Increase Max Swing Levels if you want more historical levels.
-
Select a suitable lower timeframe.
Always account for the symbol's volatility and price precision when adjusting these values.
Auto Swing Levels vs. Manual High/Low Drawing
The two tools serve different purposes.
| Feature | Manual High/Low | Auto Swing Levels |
|---|---|---|
| Price selection | User selects a candle high or low. | EA identifies candidate swing points. |
| Confirmation | Depends on the user's selection. | Waits for the configured swing confirmation. |
| Main use | Mark specific prices of interest. | Identify historical market turning points. |
| Customization | Line, ray, label, and historical settings. | Swing detection, filtering, level count, and line appearance. |
Both tools can be used together. Automatic levels provide a starting reference, while manual drawings let you mark additional prices that matter to your strategy.
Easy Manager provides settings for adjusting the location, size, and appearance of its panels.
| Setting | Default | Purpose |
|---|---|---|
| PanelX | 15 | Horizontal panel position. |
| PanelY | 20 | Vertical panel position. |
| PanelScale | 1.00 | Scale factor for panel dimensions and layout. |
| FontScale | 1.00 | Scale factor for text, where supported by the interface. |
| PanelWidth | 335 | Configured Position Opener panel width. |
| PanelHeight | 460 | Configured Position Opener panel height. |
Panel Colors
| Setting | Purpose |
|---|---|
| PanelBackground | Main panel background. |
| PanelBorder | Panel border color. |
| HeaderBackground | Header background. |
| TextColor | Main text color. |
| SecondaryTextColor | Secondary or less prominent text. |
| BuyColor | Buy-related interface elements. |
| SellColor | Sell-related interface elements. |
| AccentColor | Accent elements and highlights. |
| ButtonColor | Standard button background. |
| InputBackground | Background of input-style elements. |
Adjusting the Interface
If the panels appear too large, reduce the relevant scale setting while checking that text remains readable.
If you need to reposition the interface, adjust PanelX and PanelY.
Use contrasting text and background colors to make important controls easy to distinguish. Keep the interface readable rather than choosing colors solely for appearance.
The configured panel dimensions apply to the relevant panel implementation; other sections may have their own layout rules.
These settings apply to trade execution and help determine the size and identification of orders.
| Setting | Default | Purpose |
|---|---|---|
| DefaultLot | 0.01 | Default lot size for new trade setups. |
| LotStep | 0.01 | Lot-size adjustment increment. |
| MagicNumber | 260926 | Identifier used for applicable EA-generated orders. |
| SlippagePoints | 20 | Permitted execution deviation, in platform points, where supported. |
DefaultLot
Set the initial lot size you want the Position Opener and Trade Planner to use.
Choose a volume appropriate for the account size, the instrument, and the planned Stop Loss distance.
LotStep
Controls the increment used when adjusting the lot size with the interface controls.
For example, a step of 0.01 allows volume changes in 0.01-lot increments, subject to the broker's permitted volume settings.
MagicNumber
The Magic Number identifies applicable EA-generated trades.
If you use several EAs, distinct Magic Numbers can help distinguish their orders. Do not change this setting without considering how the EA identifies and manages existing trades.
SlippagePoints
Defines the permitted execution deviation in platform points where the order operation supports that setting.
This is not a guarantee of the final execution price. Actual fills depend on market conditions and broker execution rules.
Easy Manager includes a language setting for the interface.
The Language input determines which supported language is used for interface labels. Choose a language that makes the controls and status information easy to understand.
After changing the language, check that all labels remain readable with your chosen chart font and display scaling.
The following workflow combines the main Easy Manager tools into a single process.
Step 1: Prepare the Chart
Open the symbol you want to analyze and select your preferred timeframe.
Use Market Watch to switch between instruments. If you rely on historical price levels, ensure that sufficient chart history is loaded.
Step 2: Identify Important Price Levels
Use Auto Swing Levels to identify confirmed historical swing highs and lows.
Adjust Depth, minimum swing distance, and Max Swing Levels to keep the chart readable.
Use the manual High/Low drawing tool to mark any additional candle prices you want to monitor.
Step 3: Plan the Trade
Open the Trade Planner and select Buy or Sell.
Adjust the planned Entry, Stop Loss, and Take Profit. Review the displayed monetary risk, percentage risk, potential reward, and Risk/Reward ratio.
Use the ATR settings as a starting point if you want the planned distances to reflect recent volatility.
Step 4: Review the Risk
Check the Info Panel and ensure that the proposed position size and Stop Loss distance are appropriate for the account.
Do not assume that the estimated risk is a guaranteed maximum loss, particularly during fast markets or gaps.
Step 5: Execute the Trade
Use the appropriate order control when you are ready to proceed.
Confirm that the order was accepted and that the resulting position has the intended direction, volume, and protective levels.
Step 6: Manage the Position
Use the available position-management controls to review or manage applicable open trades.
If using Stop Loss synchronization or trailing functionality, verify the affected positions and resulting Stop Loss levels.
Step 7: Review the Results
Use the Info Panel's account and trading information to review your activity. Check the Metatrader trade history when you need to verify individual closed trades or exact transaction details.
-
Auto Swing Levels is an analysis aid. A swing high or low does not guarantee a future reversal.
-
Confirmed swing detection requires waiting for the configured number of newer candles. This delay is intentional.
-
ATR measures historical volatility; it does not predict the direction of the next price movement.
-
The Trade Planner's visual setup should be distinguished from a successfully submitted live order.
-
Estimated risk may differ from the final result because of slippage, gaps, commissions, swaps, or other execution conditions.
-
Close, synchronization, and trailing actions should be checked against the actual positions in Metatrader.
-
Test unfamiliar settings on a demo account before relying on them in live trading.
Easy Manager brings trade execution, visual trade planning, risk information, position management, symbol navigation, and price-level analysis together in one Metatrader interface.
The Position Opener supports ATR-based trade setup and position controls. The Trade Planner helps visualize Entry, Stop Loss, Take Profit, and the planned Risk/Reward relationship. The Info Panel provides account information, while Market Watch simplifies symbol navigation.
The High/Low drawing tool lets you mark specific candle prices, and Auto Swing Levels adds automatic detection of confirmed swing highs and lows.
By adjusting the settings to suit your trading style, instrument, and timeframe, you can create a clear chart-based workflow for analyzing price levels, planning trades, and managing positions.
Easy Manager is designed to support your trading decisions, while the final trading strategy, risk limits, and execution decisions remain yours.
Metatrader 4: https://www.mql5.com/en/market/product/198788?source=Site
Metatrader 5: https://www.mql5.com/en/market/product/198787?source=Site