Building Foundation 4.0: A 32-Module FX Portfolio Under Real Ticks


Foundation was built around one simple idea: I trust a portfolio of different systems more than one supposedly perfect entry. The finished EA contains 32 modules trading 12 FX pairs. Every module has its own signal and Magic Number, while the complete portfolio runs under one shared risk layer.
This review uses the longest completed test of the current 32-module build. It is a fixed-size test, not a compounded fantasy curve.
THE TEST
- MT5 full portfolio test: 1 January 2019 to 5 October 2026
- 99% real ticks
- USD 1,000 initial balance
- Fixed 0.01 lot per module
- 32 modules across 12 FX pairs
- No compounding and no lot growth as the balance increased
The MT5 report recorded 8,142 trades and USD 8,879.11 net profit, taking the account from USD 1,000 to USD 9,879.11. Profit factor was 1.39, Sharpe was 2.67 and recovery factor was 43.88.
The maximum relative equity drawdown was 11.09%. It happened early in the test: equity fell from USD 1,159.42 to USD 1,030.87 between 25 January and 25 February 2019. The curve looks dramatic there because the same fixed 0.01 lots were much larger relative to the small starting balance. The account was still above its initial USD 1,000.

HOW I DIVIDED THE HISTORY
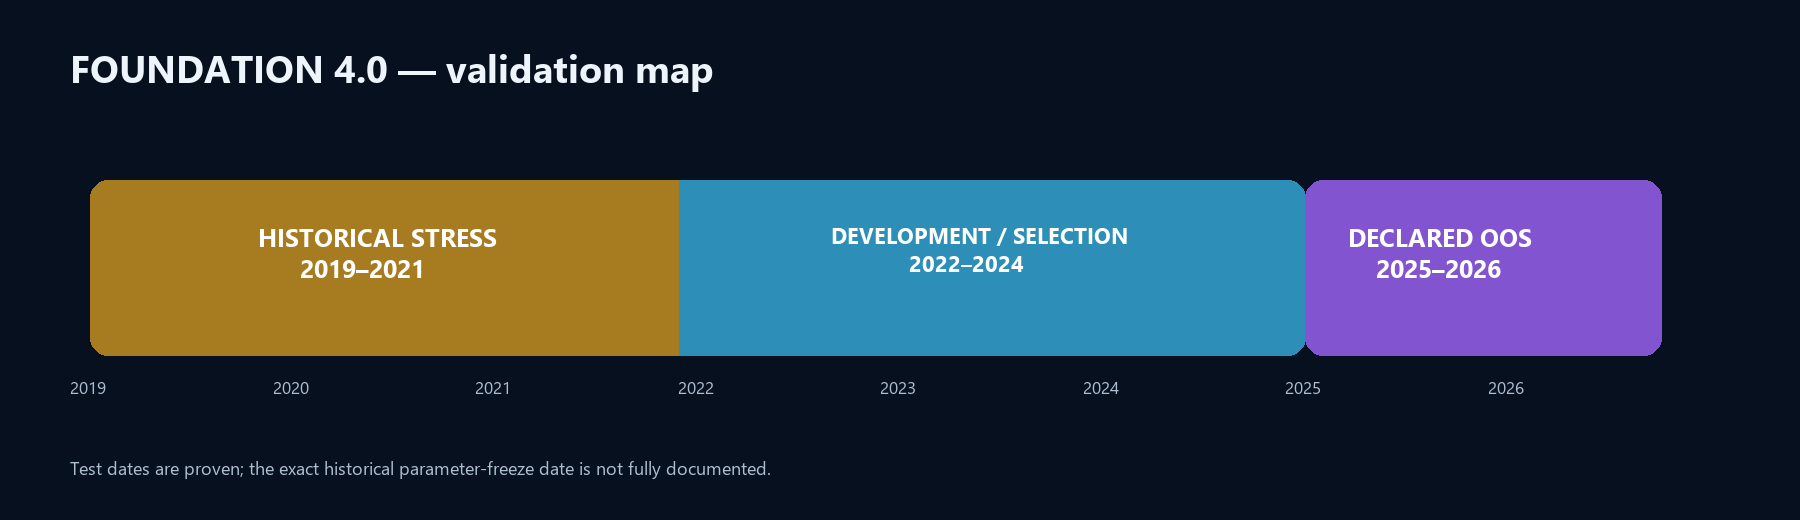
I treat 2019–2021 as historical stress and survival evidence, 2022–2024 as the development and selection window, and 2025–2026 as declared out-of-sample.
The test dates are proven, but I do not have a complete timestamped archive showing the exact freeze date of every module. That is why I call the final segment declared OOS, rather than independently audited OOS.
RESULTS BY SEGMENT
| Segment | Trades | Net profit | Profit factor | Win rate | Max realised balance DD |
|---|---|---|---|---|---|
| Full 2019–2026 | 8,130 | USD 8,867.68 | 1.39 | 50.6% | USD 200.90 |
| Historical stress 2019–2021 | 2,883 | USD 3,085.64 | 1.36 | 51.0% | USD 165.02 |
| Development/selection 2022–2024 | 3,514 | USD 3,792.08 | 1.39 | 50.1% | USD 200.90 |
| Declared OOS 2025–2026 | 1,733 | USD 1,989.96 | 1.43 | 50.9% | USD 129.08 |
The reconstructed cash-flow totals include profit, swap, commission and fees. The diagnostic CSV contains 8,130 closed positions and USD 8,867.68 net profit. MT5 additionally closed 12 positions at the end of the test, bringing the official headline to 8,142 trades and USD 8,879.11.
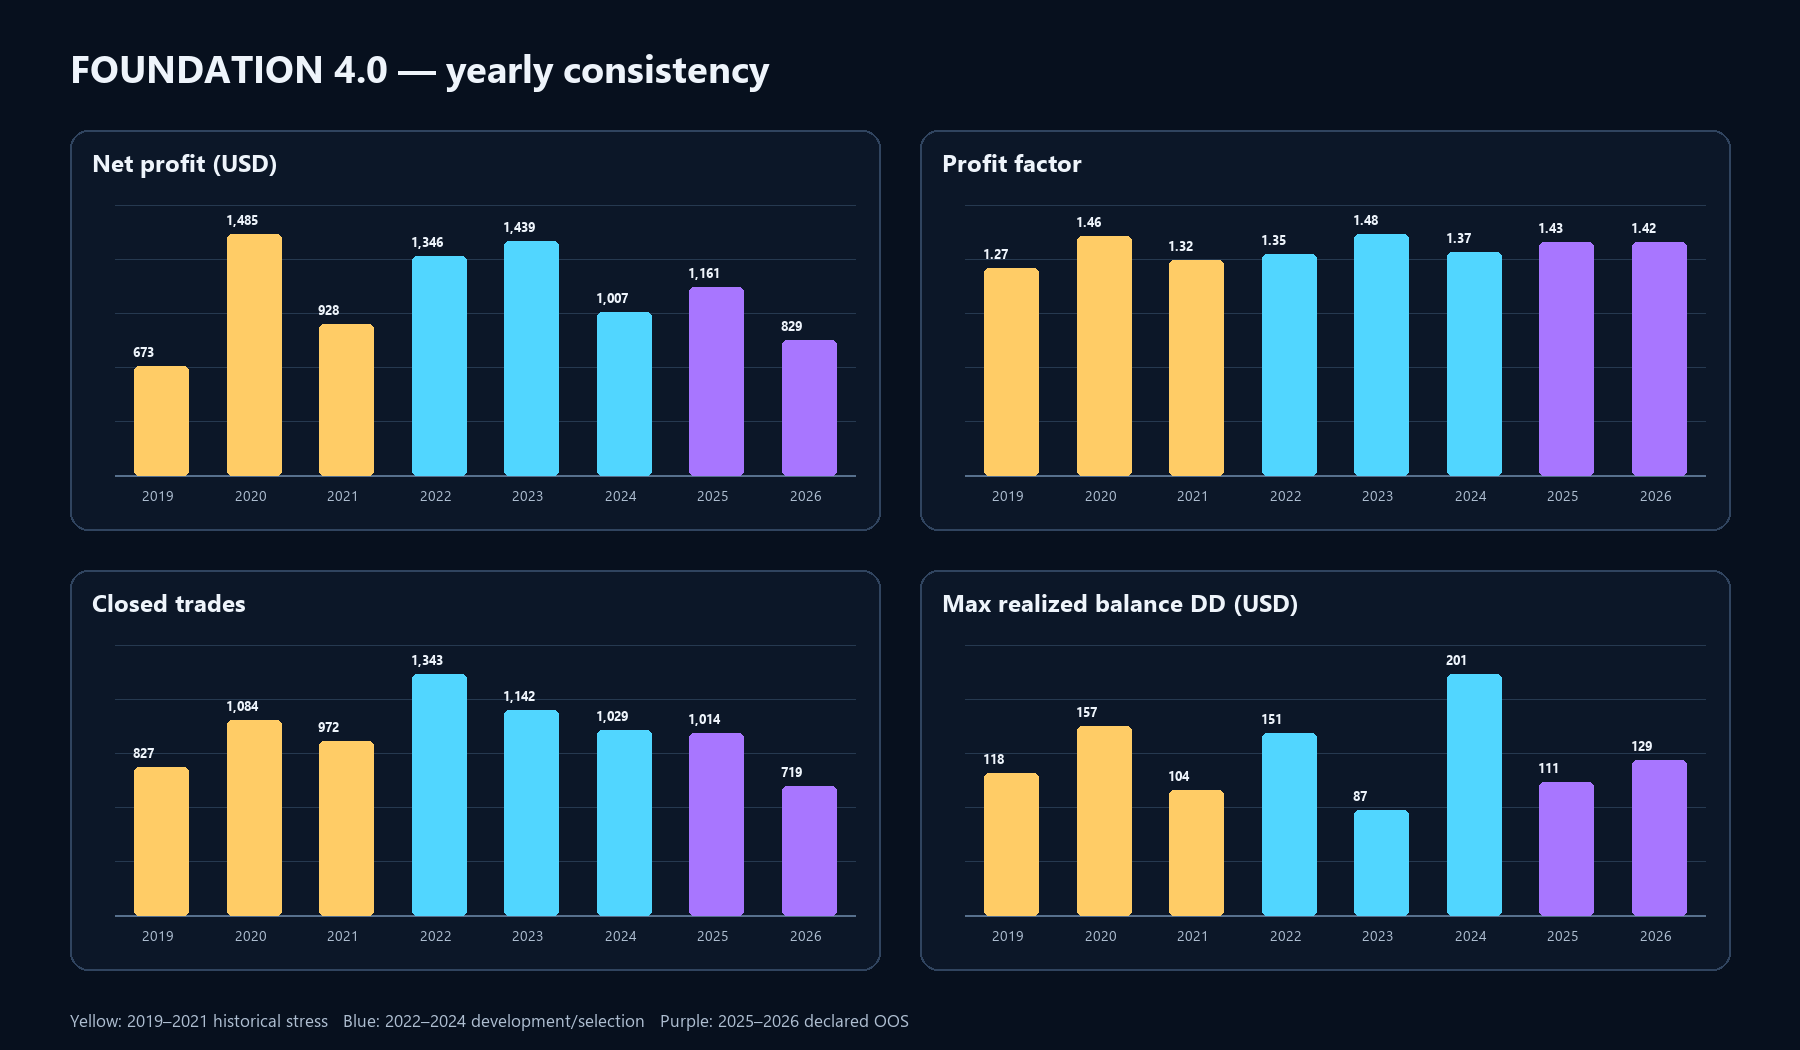
The yearly view matters more to me than the final number. One lucky year can create a beautiful backtest. A system that stays positive across several unrelated regimes is harder to dismiss, although it can still fail live.
WHAT HAPPENED INSIDE THE PORTFOLIO
The total win rate was only about 50.5%. Foundation does not rely on an extreme win rate or a hidden averaging ladder. Its edge comes from many small independent decisions, with the average winner larger than the average loser in the MT5 report.
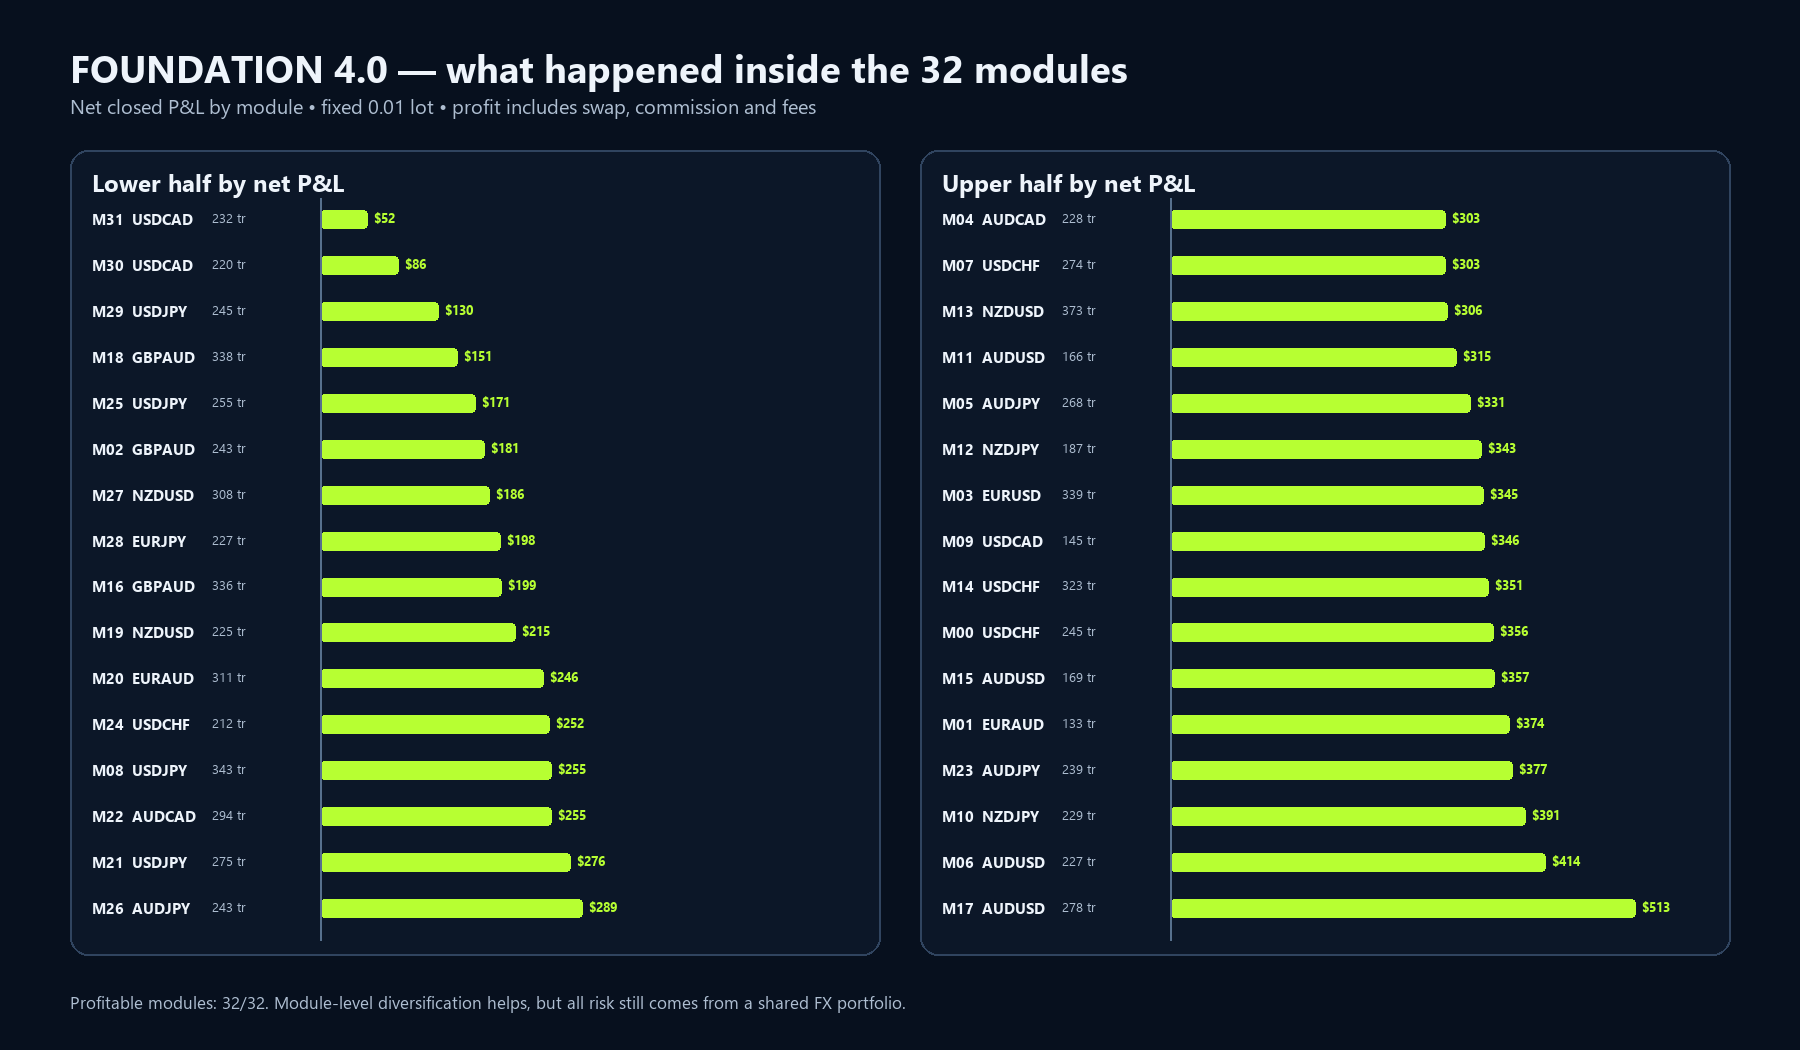
Module diversification is useful, but it should not be confused with complete independence. Several modules trade related currencies, so USD or broad risk moves can make apparently separate systems lean in the same direction.
MONTE CARLO
The Monte Carlo uses the complete 2019–2026 closed-trade sequence. I ran 10,000 circular block-bootstrap paths with 20-trade blocks. Because the EA uses fixed lots, every path is built by adding dollar P&L. There is no compounding. Keeping short blocks together preserves some local clustering while changing their order and repetition.
- Median terminal balance: USD 9,888
- 5th–95th percentile terminal balance: USD 8,583 to USD 11,178
- Median simulated maximum realised balance DD: USD 190
- 95th percentile simulated maximum realised balance DD: USD 280
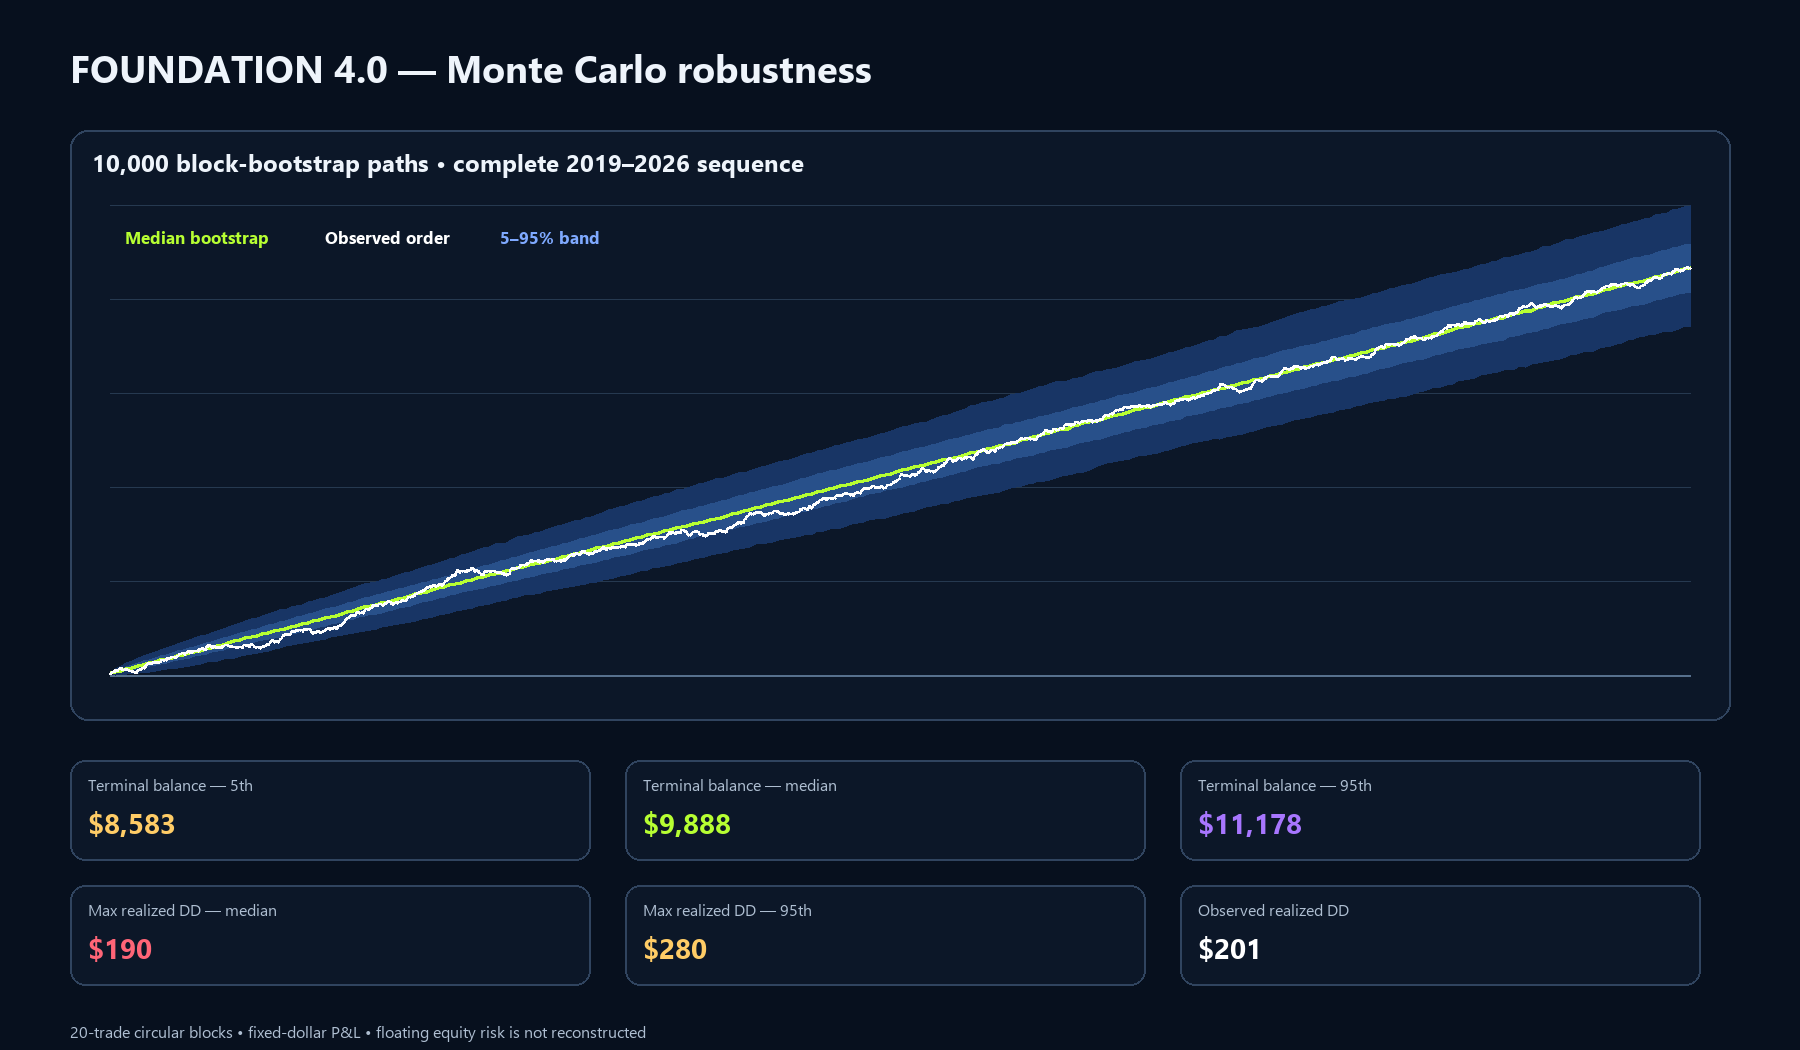
This Monte Carlo measures sequence risk in closed-trade cash flows. It cannot recreate the portfolio's intratrade floating equity exposure, so the MT5 equity drawdown remains the primary observed drawdown figure.
WHAT THE TEST PROVES — AND WHAT IT DOES NOT
The good news is straightforward: one fixed 32-module portfolio remained profitable from 2019 through 2026, retained a 1.39 profit factor after broker costs and kept observed relative equity drawdown near 11%. The 2025–2026 holdout also stayed profitable.
The limitations are equally important. A backtest cannot reproduce future spreads, slippage, rejected orders or a currency regime that does not exist in the sample. The modules also share portfolio-level currency exposure. A fully audited OOS claim would require archived pre-2025 binaries, presets and hashes.
The next filter is live trading. The backtest earns Foundation the right to be observed; it does not award the system a permanent edge.