How to Scalp XAUUSD M1/M5 with SuperScalp Pro during London Session

SuperScalp Pro is a multi-layer confluence scalping indicator built on an enhanced Supertrend core. It combines trend, momentum, volume and volatility filters with an interactive dashboard and a built-in Trading Statistics Simulator.
This guide focuses on one of the most popular setups: scalping XAUUSD on M1 or M5 during the London session, and shows you exactly how to evaluate recent performance using the Days to Simulate feature.
🌍 Why London Session for XAUUSD Scalping?
The London session (roughly 08:00–17:00 broker time, depending on your server) usually brings the highest liquidity and cleanest directional moves on Gold.
Volatility expands, spreads tighten on ECN accounts, and multi-layer confirmation systems like SuperScalp Pro tend to produce higher-quality signals compared with the quieter Asian session.
⏱️ Recommended Timeframes
- 🟢 M5 – balanced frequency and signal quality (most popular)
- ⚡ M1 – higher frequency for experienced scalpers (requires tighter risk and faster execution)
⚙️ Recommended Filter Setup (from real chart example)

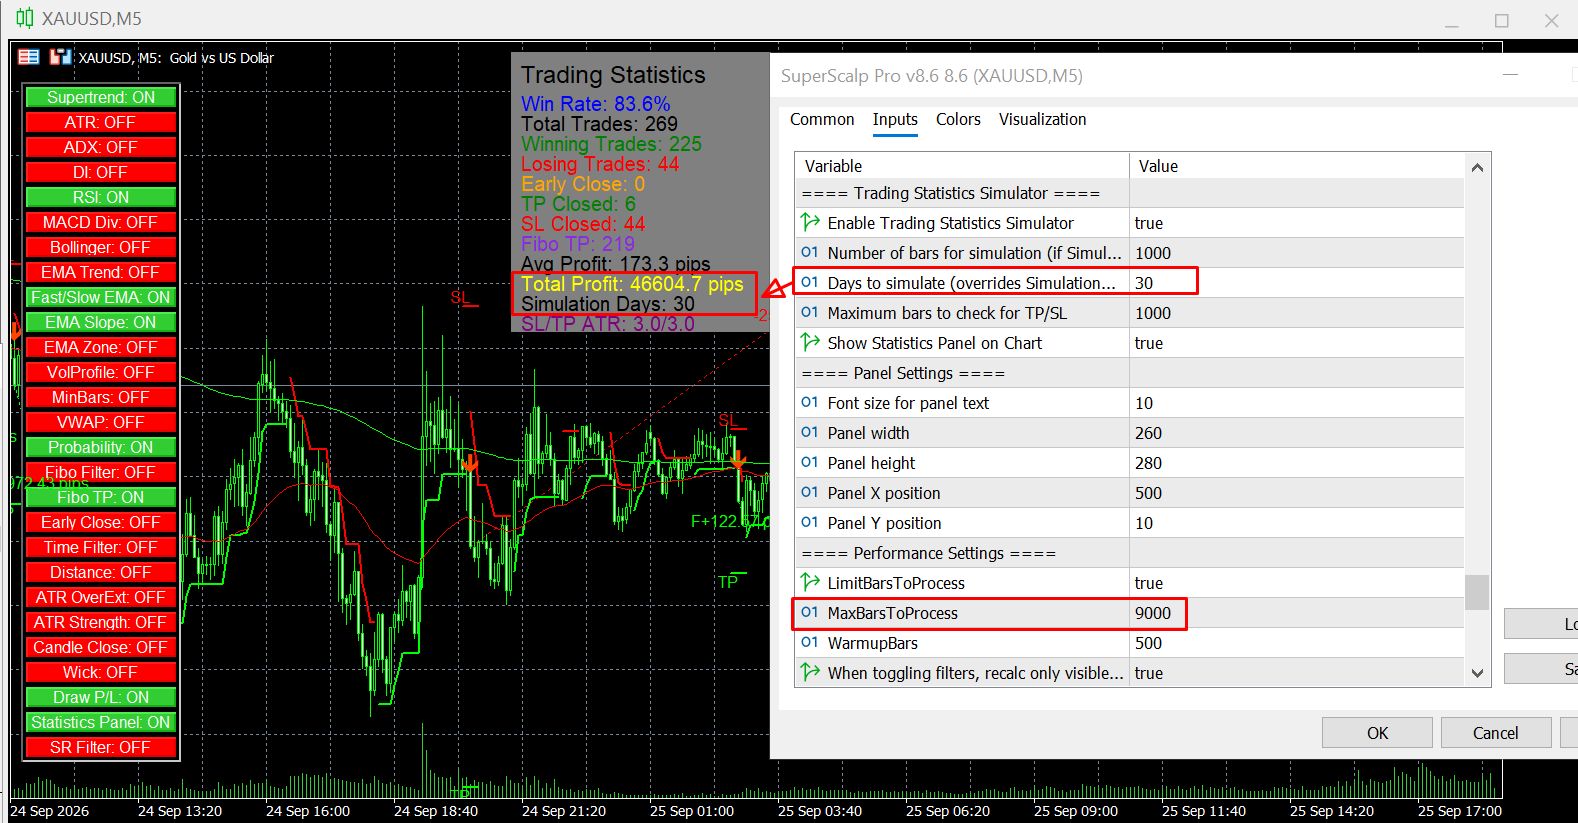
On the example chart (XAUUSD M5) the following filters were enabled:
🟢 ON (green)
- Supertrend
- RSI
- Fast/Slow EMA
- EMA Slope
- Probability
- Fibo TP
- Draw P/L
- Statistics Panel
🔴 OFF (red)
- ATR
- ADX
- DI
- MACD Divergence
- Bollinger
- EMA Trend
- EMA Zone
- VolProfile
- MinBars
- VWAP
- Fibo Filter
- Early Close
- Time Filter
- Distance
- ATR OverExt
- ATR Strength
- Candle Close
- Wick
- SR Filter
This combination keeps the core trend filter active while adding momentum (RSI), EMA structure and probability confirmation, plus Fibonacci take-profit levels.
You can toggle any filter instantly on the interactive Control Panel without reopening the inputs.
🎯 Risk settings used in the example
SL/TP ATR Multiplier = 3.0 / 3.0
One of the strongest features of SuperScalp Pro is the Trading Statistics Simulator.
Instead of counting candles manually, you can simply tell the indicator how many recent days you want to analyse.
🔎 How “Days to Simulate” Works
- SimulationDays = 0 → the simulator uses the SimulationBars value.
- SimulationDays > 0 → the simulator uses the specified number of days and ignores SimulationBars.
- If there is not enough historical data on the chart, only the available data is used.
🛠️ Recommended Settings for a 30-Day Test
In the Trading Statistics Simulator section set:
Enable Trading Statistics Simulator = true Show Statistics Panel on Chart = true Days to simulate = 30 SimulationBars = 0 MaxBarsToCheck = 10000
📌 What these values mean
- SimulationDays = 30 → the indicator simulates signals from approximately the last 30 days on the current timeframe.
- MaxBarsToCheck = 10000 → maximum number of candles examined when evaluating TP/SL for each simulated trade (5000–20000 is a practical range).
📅 Quick Timeframe Reference (candles per day)
| Timeframe | Approx. Candles per Day |
|---|---|
| M1 | ~1,440 |
| M5 | ~288 |
| M15 | ~96 |
| M30 | ~48 |
| H1 | ~24 |
| H4 | ~6 |
| D1 | 1 |
💡 Examples
- M5 × 30 days ≈ 8,640 candles
- M15 × 30 days ≈ 2,880 candles
- H1 × 30 days ≈ 720 candles
You can keep the same SimulationDays = 30 value across different timeframes; the simulator automatically adapts.
On the chart below (XAUUSD M5) with the filter combination listed earlier and Days to simulate = 30, the Statistics Panel showed:
| Statistic | Result |
|---|---|
| Win Rate | 83.6% |
| Total Trades | 269 |
| Winning Trades | 225 |
| Losing Trades | 44 |
| TP Closed | 6 |
| SL Closed | 44 |
| Fibo TP | 219 |
| Avg Profit | 173.3 pips |
| Total Profit | 46,604.7 pips |
| Simulation Days | 30 |
| SL/TP ATR | 3.0 / 3.0 |
These numbers are produced directly on the chart by the built-in simulator.
They help you quickly compare different filter combinations before you move to forward testing.
1️⃣ Attach the Indicator
Attach SuperScalp Pro to an XAUUSD M5 (or M1) chart.
2️⃣ Load a Set File
Load a recommended set file or manually enable the filters you want to test.
3️⃣ Open the Simulator Settings
Open the indicator inputs → Trading Statistics Simulator section.
4️⃣ Set the Following Values
Enable Trading Statistics Simulator = true
Show Statistics Panel on Chart     = true
Days to simulate                   = 30
MaxBarsToCheck                     = 10000 (or higher if needed)
5️⃣ Apply the Settings
Click OK.
The Statistics Panel appears on the chart and updates automatically.
6️⃣ Compare Different Filters
Toggle filters on the Control Panel and watch the statistics change in real time.
7️⃣ Forward Test
Once you find a configuration you like, switch to a Demo account or Strategy Tester visual mode for forward testing.
- 📊 Simulation results are based on historical signals only. They do not include spread, commissions or slippage.
- 🔄 Results change when you enable/disable filters or change ATR multipliers.
- 💾 Make sure your MT5 chart has enough historical data for the selected symbol and timeframe.
- ⚠️ W1 and MN1 timeframes are not recommended for the Days to Simulate feature.
- 📈 The simulator is a tool for historical analysis and configuration comparison. It is not a guarantee of future performance.
1️⃣ Download and Test
Download the Free Demo of SuperScalp Pro and test the exact setup above on your own broker data.
2️⃣ Load the Recommended Set Files
Load the recommended set files (XAUUSD Fibo version) from the product blog.
3️⃣ Automate Your Trading
Combine the indicator with SuperScalp Pro Auto Trader (Mode 2) if you want full automation.
Product page: SuperScalp Pro
User Guide & Set Files: available on the product page and in the related blog posts.
Always test thoroughly on a Demo account before using real money.
Trading involves significant risk and past performance (including simulated results) is not indicative of future results.
💪 Happy scalping!
Van Minh Nguyen
Download & Support:
📌 SuperScalp Pro indicator:
https://www.mql5.com/en/market/product/149074
📌 SuperScalp Pro Auto Trader EA :
https://www.mql5.com/en/market/product/176681
📌 Support:
https://www.mql5.com/en/users/minhnguyen1504