
How to Find High-Probability Support and Resistance Levels in Forex Trading

How to Find High-Probability Support and Resistance Levels in Forex Trading
Support and resistance are among the most important concepts in technical analysis and price action trading. Almost every market, from Forex and stocks to cryptocurrencies, reacts to important price levels where buying and selling pressure changes.
However, simply drawing horizontal lines on a chart is not enough. The real skill is learning how to identify high-probability support and resistance levels, understand why price reacts to them, and use them as part of a complete trading plan.
In this guide, you will learn how support and resistance work, how to identify stronger levels, how to combine them with other technical factors, and how to use them for entries, stop losses, and profit targets.
What Are Support and Resistance?
Understanding Support
A support level is a price area where buying pressure is strong enough to slow down or stop a decline.
When price approaches a previous support zone, traders may expect buyers to become active again. If enough buying pressure enters the market, price can reject the level and move higher.
Support can develop because of:
-
Previous market reactions
-
Strong buying activity
-
Psychological price levels
-
Previous swing lows
-
Higher-timeframe market structure
-
Confluence with technical indicators
It is important to remember that support is usually better viewed as a zone rather than an exact price line.
Understanding Resistance
A resistance level is a price area where selling pressure can slow down or stop an upward move.
When price reaches a previous resistance zone, sellers may become more active. If selling pressure is strong enough, the market can reject the area and move lower.
Common sources of resistance include:
-
Previous swing highs
-
Historical price reactions
-
Psychological round numbers
-
Higher-timeframe resistance
-
Moving averages
-
Fibonacci levels
Understanding these areas helps traders identify where the balance between buyers and sellers may change.
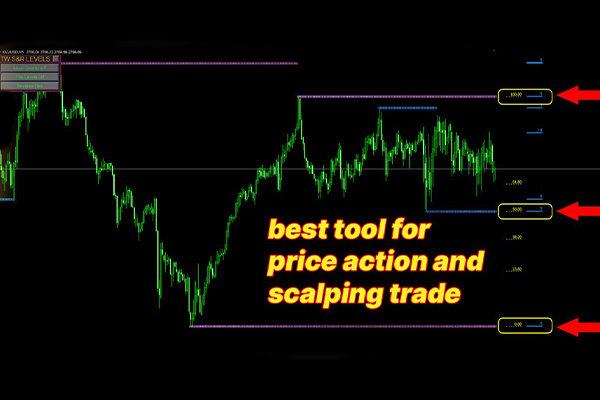
Why Support and Resistance Matter in Technical Analysis
Support and resistance are closely connected to market psychology and price action.
When price reacts strongly from a particular area, traders remember that level. If price returns to the same area later, previous buyers or sellers may react again.
This creates what is often called market memory.
For example, if EUR/USD repeatedly falls toward a specific price area and then rallies, that area may become an important support zone. Similarly, if price repeatedly fails to break above a certain area, traders may identify it as resistance.
The goal is not to predict exactly what price will do. Instead, traders can use these levels to identify areas where the probability of a meaningful reaction may increase.
How to Identify High-Probability Support and Resistance Levels
Not every level on a chart has the same importance. Strong traders focus on levels supported by multiple pieces of evidence.
1. Look for Multiple Touches and Clear Reactions
One of the simplest ways to evaluate a support or resistance level is to examine how price behaved there in the past.
A level that has produced several clear reactions can be more significant than an area that price touched only once.
Look for:
-
Multiple price tests
-
Strong rejection candles
-
Significant moves away from the level
-
Clear swing highs or swing lows
-
Repeated failures to break through the area
However, more touches do not automatically mean a level will always hold. Market conditions can change, and eventually a strong breakout may occur.
The quality of the reaction is often more important than simply counting the number of touches.
2. Prioritize Higher-Timeframe Levels
Higher-timeframe charts can reveal important support and resistance zones that may not be obvious on lower timeframes.
For example, a trader might first analyze the:
-
Weekly chart
-
Daily chart
-
4-hour chart
and then move to lower timeframes to look for a potential entry.
This approach is commonly known as top-down analysis.
A support zone visible on the daily chart may carry more significance than a minor level that appears only on a five-minute chart.
Higher-timeframe analysis can also help traders avoid taking trades based on insignificant short-term price movements.
3. Watch for Support and Resistance Role Reversal
One of the most useful concepts in technical analysis is role reversal.
When price breaks a significant support level, that previous support can later act as resistance.
Likewise, when price breaks above resistance, that previous resistance can become support.
This behavior is often observed during a break and retest.
For example:
-
Price approaches resistance.
-
Price breaks above the resistance zone.
-
Price returns to test the previous resistance.
-
The old resistance holds as support.
-
Price continues higher.
A similar process can happen in the opposite direction after a bearish breakout.
The important point is to wait for evidence that the level has actually changed roles rather than assuming every breakout will produce a successful retest.
4. Use Confluence to Increase Confirmation
A support or resistance zone becomes more interesting when several independent technical factors point toward the same area.
This is known as confluence.
Potential confluence factors include:
-
Historical support or resistance
-
Fibonacci retracement levels
-
Round numbers
-
Moving averages
-
Trend lines
-
Market structure
-
Higher-timeframe levels
-
Price action signals
For example, if a daily support zone also aligns with a Fibonacci retracement and a major psychological price level, traders may pay closer attention to that area.
Confluence does not guarantee a successful trade. It simply provides additional context for evaluating a setup.
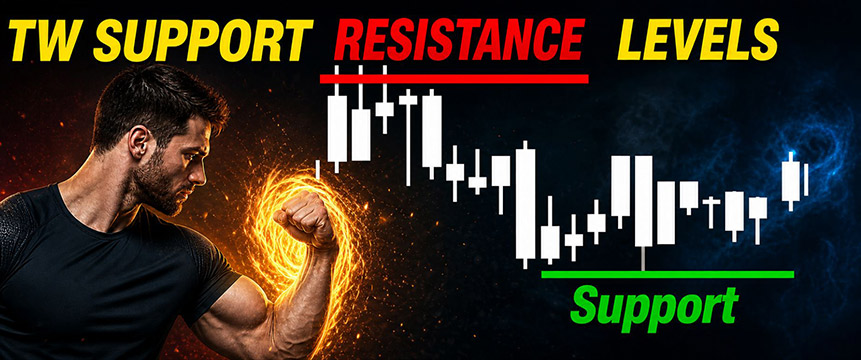
How to Use Support and Resistance in Your Trading
Identifying a level is only the first step. Traders also need a clear plan for how they will react when price reaches that area.
Entries and Price Action Confirmation
A common mistake is entering a trade immediately because price has reached support or resistance.
A better approach for many price action traders is to wait for confirmation.
Possible confirmation signals include:
-
Pin bars
-
Engulfing candles
-
Inside bars
-
Strong rejection candles
-
Break-and-retest patterns
-
Changes in short-term market structure
For example, if price reaches a daily support zone, a trader may wait for a bullish rejection candle before considering a long setup.
This approach can help distinguish between a genuine reaction and a simple temporary pause before price continues through the level.
Stop Losses and Profit Targets
Support and resistance can also provide a logical framework for stop-loss placement and profit targets.
For a long trade near support, a trader may consider placing the stop loss beyond the support zone rather than directly on the level.
For a short trade near resistance, the stop loss may be placed beyond the resistance area.
Potential profit targets can be based on the next significant support or resistance zone.
For example:
Long setup:
Support → Entry → Next Resistance → Profit Target
The distance between the entry, stop loss, and target should also be evaluated as part of a broader risk management plan.
A technically attractive setup does not automatically make a trade suitable if the potential risk is too large relative to the potential reward.
Combine Support and Resistance With Trend Context
Support and resistance should not be analyzed in isolation.
Market context matters.
In an established uptrend, traders may pay particular attention to pullbacks toward support. In a downtrend, resistance zones may become more relevant when price rallies.
This does not mean every support level in an uptrend will hold or every resistance level in a downtrend will reject price.
Instead, the trend provides additional context for interpreting price action.
Combining:
Trend + Higher-Timeframe Level + Price Action + Confluence
can provide a more structured approach to analyzing potential setups.
Practical Tips for Cleaner Support and Resistance Analysis
Focus on Price Zones, Not Perfect Lines
Markets rarely react to a single exact price.
Instead of drawing dozens of precise horizontal lines, consider marking support and resistance zones.
A zone represents an area where buyers or sellers have previously shown significant interest.
This approach can make chart analysis more realistic and reduce the tendency to expect price to reverse at one exact number.
Pay Attention to Candle Bodies and Wicks
Candlestick wicks can show rejection, while candle bodies can provide information about where price was accepted during a particular period.
Rather than relying exclusively on either one, examine the entire price structure.
A long wick followed by a strong move away from a level may provide useful evidence of rejection.
Keep Your Chart Clean
One of the biggest problems traders face is marking too many levels.
If every minor high and low becomes a support or resistance line, the chart quickly becomes difficult to interpret.
Focus on the most significant zones, especially those visible on higher timeframes.
A cleaner chart can make important market structure easier to recognize.
Review and Update Your Levels
Support and resistance are not permanent.
A level that was important several months ago may become less relevant as new market structure develops.
Review your charts regularly and remove levels that no longer have meaningful price reactions.
New swing highs, swing lows, breakouts, and retests can create new areas that deserve attention.
Common Mistakes When Trading Support and Resistance
Understanding common mistakes can improve the way these levels are used.
Treating Every Level as Guaranteed
Support does not guarantee a bounce, and resistance does not guarantee a reversal.
Both can be broken.
Entering Without Confirmation
Price reaching a support or resistance zone is not necessarily a complete trading signal.
Waiting for appropriate price action confirmation can provide additional information.
Ignoring the Higher Timeframe
A minor support level on a lower timeframe may be insignificant when price is approaching a major weekly resistance zone.
Always consider the broader market structure.
Drawing Too Many Levels
Too many lines can create confusion and encourage traders to find signals where none exist.
Prioritize quality over quantity.
Putting Support and Resistance All Together
Effective support and resistance trading is not about finding a magical line that predicts exactly where price will reverse.
The objective is to identify high-probability levels by combining historical price reactions, market structure, higher-timeframe analysis, confluence, and price action.
A practical process can look like this:
-
Start with the higher-timeframe chart.
-
Mark major support and resistance zones.
-
Identify the current market trend and structure.
-
Look for areas with multiple forms of confluence.
-
Wait for price to reach the zone.
-
Look for price action confirmation.
-
Define the stop loss before entering.
-
Identify logical profit targets.
-
Manage risk according to your trading plan.
-
Review the trade and update your levels as market conditions change.
The key is to remain selective. A clean chart with a few well-defined levels is often more useful than a chart filled with technical lines.
Support and resistance are powerful components of technical analysis and price action trading, but they work best when combined with disciplined risk management and a clearly defined trading process.