More EAs Do Not Automatically Mean More Diversification

Ten EA files can represent far fewer than ten distinct sources of behavior. Several may depend on the same currency move, trade in the same session or suffer when the same market regime ends. Different names and entry rules do not establish diversification.
For a portfolio, the useful question is what changes when another EA is added. Does it introduce meaningfully different behavior, or does it increase exposure to something already present?
Group the dependencies before counting strategies
Consider an illustrative ten-EA portfolio. Some EURUSD and GBPUSD systems depend on USD direction and persistent trends. Several XAUUSD systems share momentum and volatility exposure during London or New York hours. Others rely on range-bound, quieter conditions for mean reversion.
That portfolio can be described as ten strategies or as a few broad risk clusters. The clusters are a way to organize dependencies, not a claim that there are exactly three independent risks. The example is conceptual, not a classification of an EdgeDriven product.
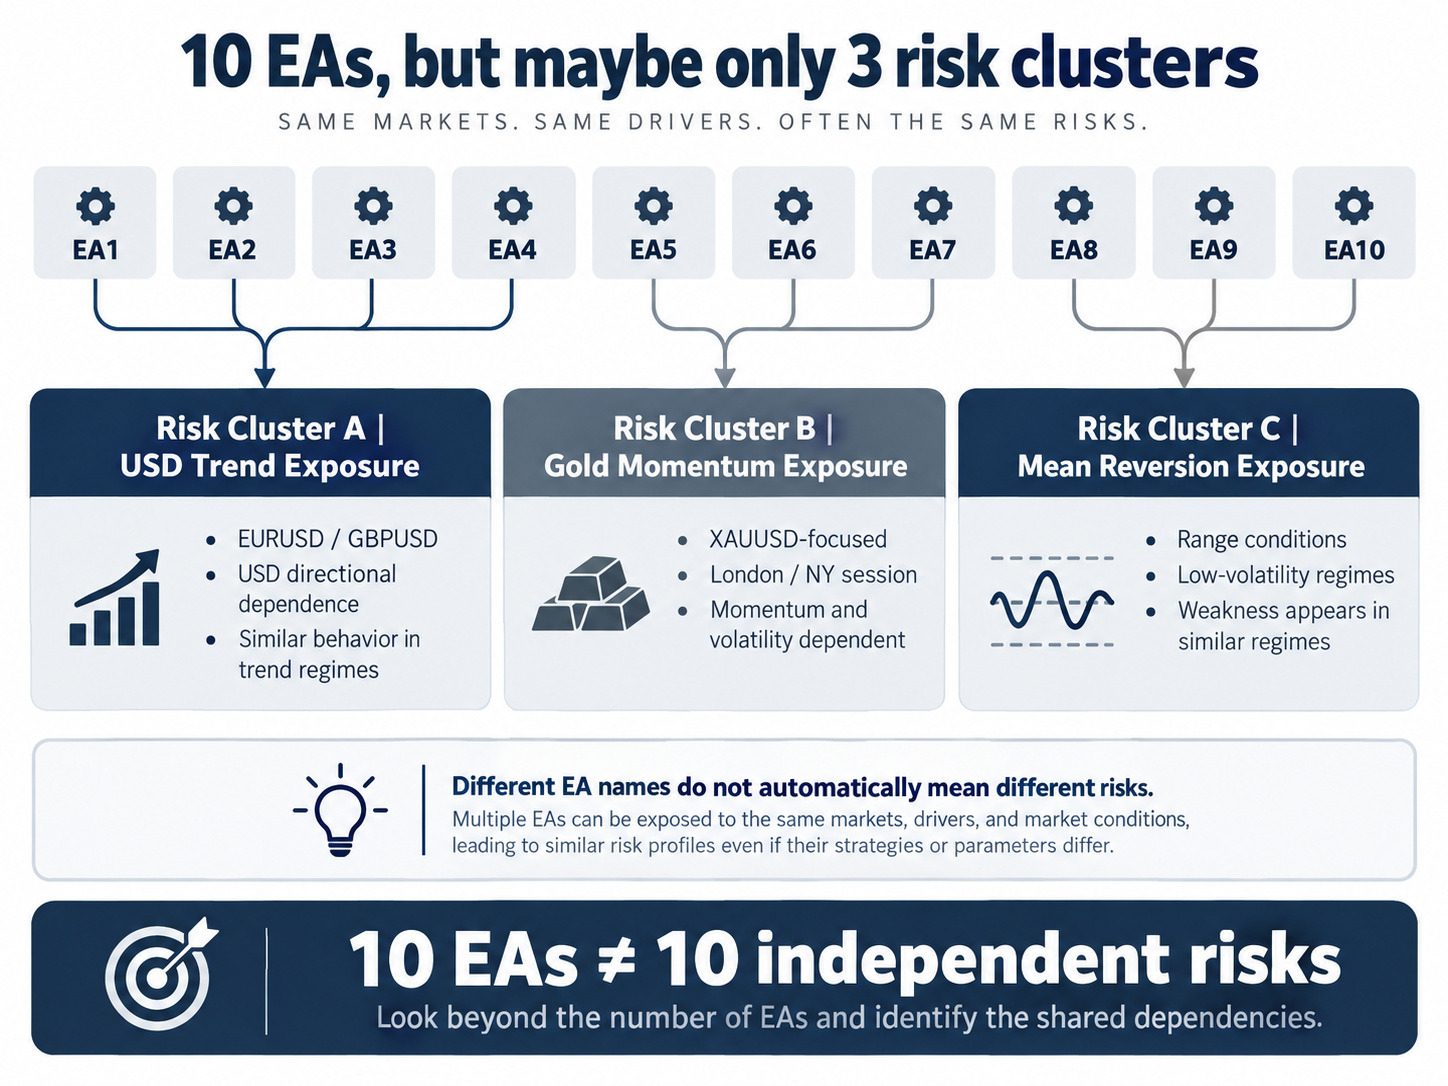
AI-generated example of shared dependencies. The grouping does not establish independence between risk clusters.
Look beneath the symbol name
Shared exposure can involve the symbol, currency, direction, trading session, market regime, volatility sensitivity, loss timing and simultaneous positions. Two different symbols can still carry similar currency exposure. Strategies that behave differently in normal periods can also react to the same macro shock.
An exposure map makes those relationships easier to inspect. For each EA, record what it trades, which direction of exposure it can carry, when it tends to be active and which conditions have been difficult. Then compare those rows instead of relying on a list of strategy names.
The map does not remove overlap. It makes concentration visible so that adding another strategy can be evaluated in context.
Average correlation can miss a shared bad period
Return correlation is useful for identifying strategies whose profit and loss tend to move together. Use matching observation intervals, such as daily returns, rather than infer it from the appearance of cumulative equity curves. Lower correlation can indicate less similar behavior over the period measured. It is not proof of independence or of limited losses when markets become stressed.
Suppose several EAs behave differently for most of the sample, then all suffer during a trend reversal or volatility spike. Their average correlation may remain low even though the loss overlap during the difficult interval is substantial.
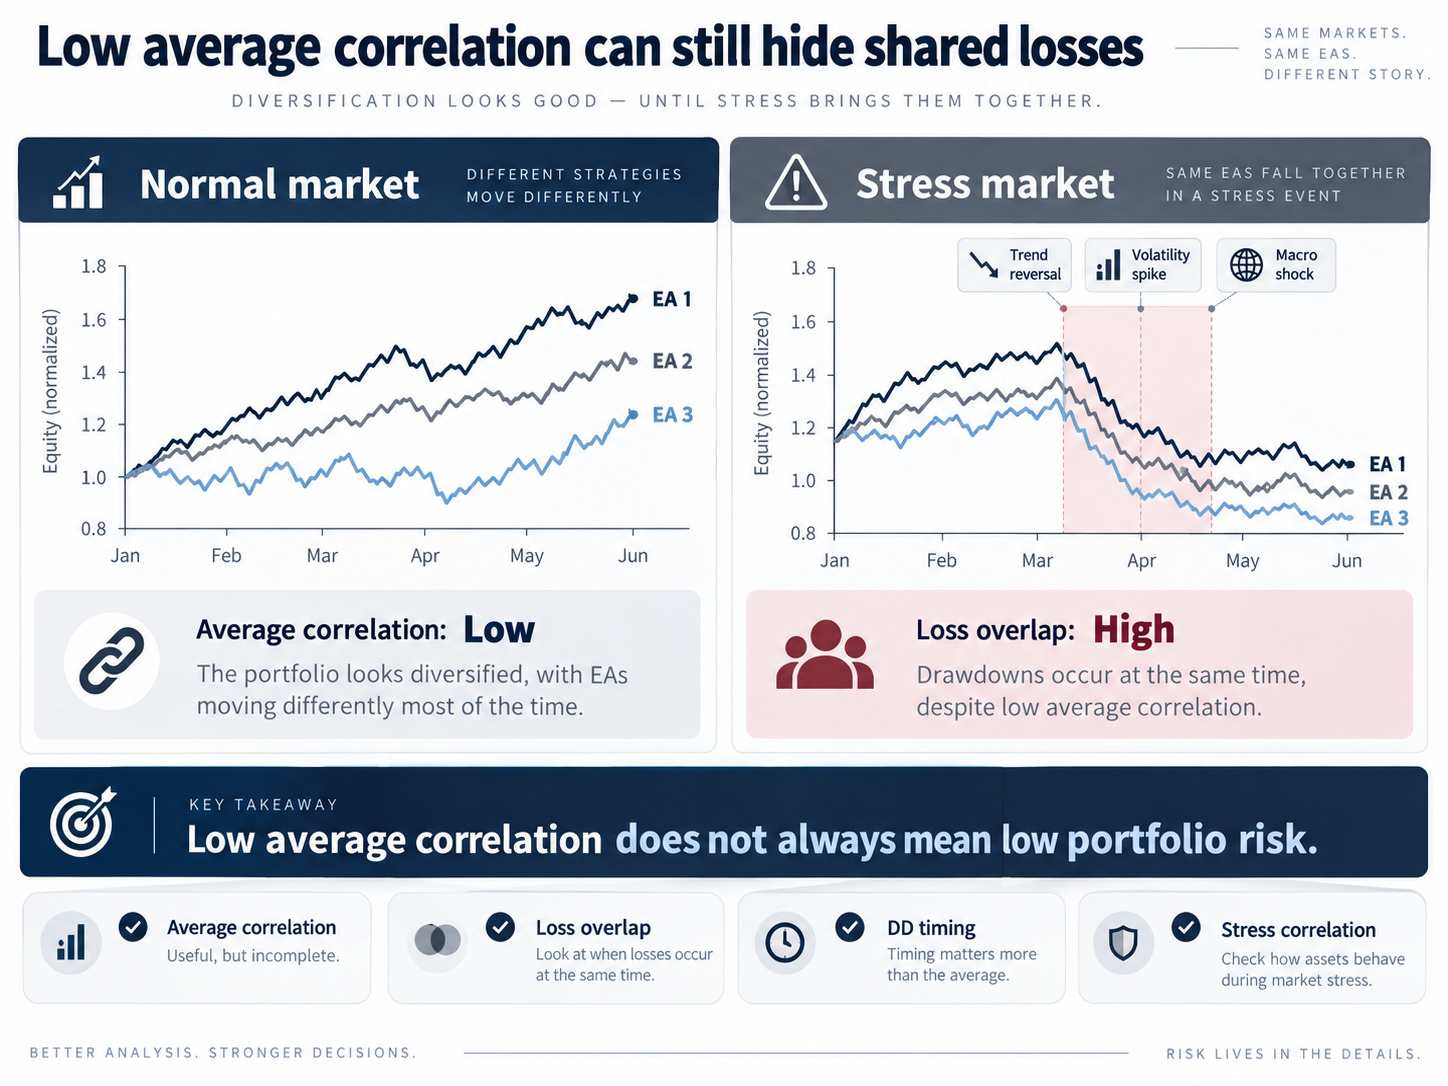
AI-generated illustration of overlapping loss periods. No correlation coefficient was calculated from these drawn curves.
A practical review therefore looks specifically at the largest loss days, major drawdown periods and worst historical intervals. Do other EAs lose during those same windows? Does correlation rise in stress? Do they hold effectively the same exposure at the same time?
These questions add information that a single full-period correlation figure cannot provide.
Current positions are another layer of risk
Several systems may be short USD across different pairs, or several Gold EAs may be long at once. That creates shared exposure regardless of how different the individual backtests look.
Historical return analysis and simultaneous-exposure analysis should therefore sit alongside each other. One examines how the strategies behaved over time. The other asks how many can carry the same risk together. Neither is replaced by the number of EAs in the account.
Compare the effect of adding the next EA
An EA with a lower standalone PF may be a more useful addition if its losses overlap less with the existing portfolio. That is a comparison among candidates with adequate individual quality, not a reason to accept a weak strategy solely because it is different.
Conversely, several excellent standalone EAs can make a concentrated portfolio if their worst periods coincide. The contribution of a candidate depends partly on when it loses and which existing strategies lose alongside it.
Changing a few parameters, adding a similar trend system or applying related logic to another symbol can increase the strategy count without changing that dependency very much. The portfolio should be assessed on the combination's behavior, not the appearance of variety in its component list.
For an EA buyer, the useful follow-up to “multi-strategy” is an explanation of shared exposure, loss overlap and drawdown timing. Diversification is an attempt to reduce excessive dependence on the same conditions; it is not a promise that losses cannot occur together.
Product details and testing conditions
For a multi-strategy product, read the shared-exposure and operating limits as well as its historical result.
Specifications, published historical results and operating limits: EdgeDriven Gold Portfolio — XAUUSD · EdgeDriven Dollar Yen Portfolio — USDJPY.
The examples in this article explain evaluation methods; they are not test results for those products. Historical simulations do not guarantee future results. Leveraged trading can cause substantial losses.