
Two Weeks Live: Minimum Lot vs. 5% Risk per Order in a Six-Market EA

Backtests are useful, but a public live record answers a different question: how does an Expert Advisor behave under real broker conditions when spreads, execution, swaps, margin and several markets interact?
Breakouter X6 Portfolio has now been running on two separate live accounts for approximately two weeks. This article documents a dated snapshot from 4 September 2026. It is an early observation, not a performance conclusion.
Product page and free Strategy Tester demo:
Breakouter X6 Portfolio
The two accounts use the same six-market portfolio concept, but they have different starting dates, starting capital and lot-sizing rules. They are not a controlled comparison and their percentage returns must not be read as if one setting had defeated the other.
Account 1: Minimum broker lot
- Starting balance: 4,000.00 USD
- Balance in the dashboard snapshot: 4,209.67 USD
- Net after costs since start: +209.61 USD
- Return based on the dashboard snapshot: +5.24%
- Lot setting: minimum volume permitted by the broker
- Snapshot status: 0 open positions, 60 pending orders, peak account order count 64
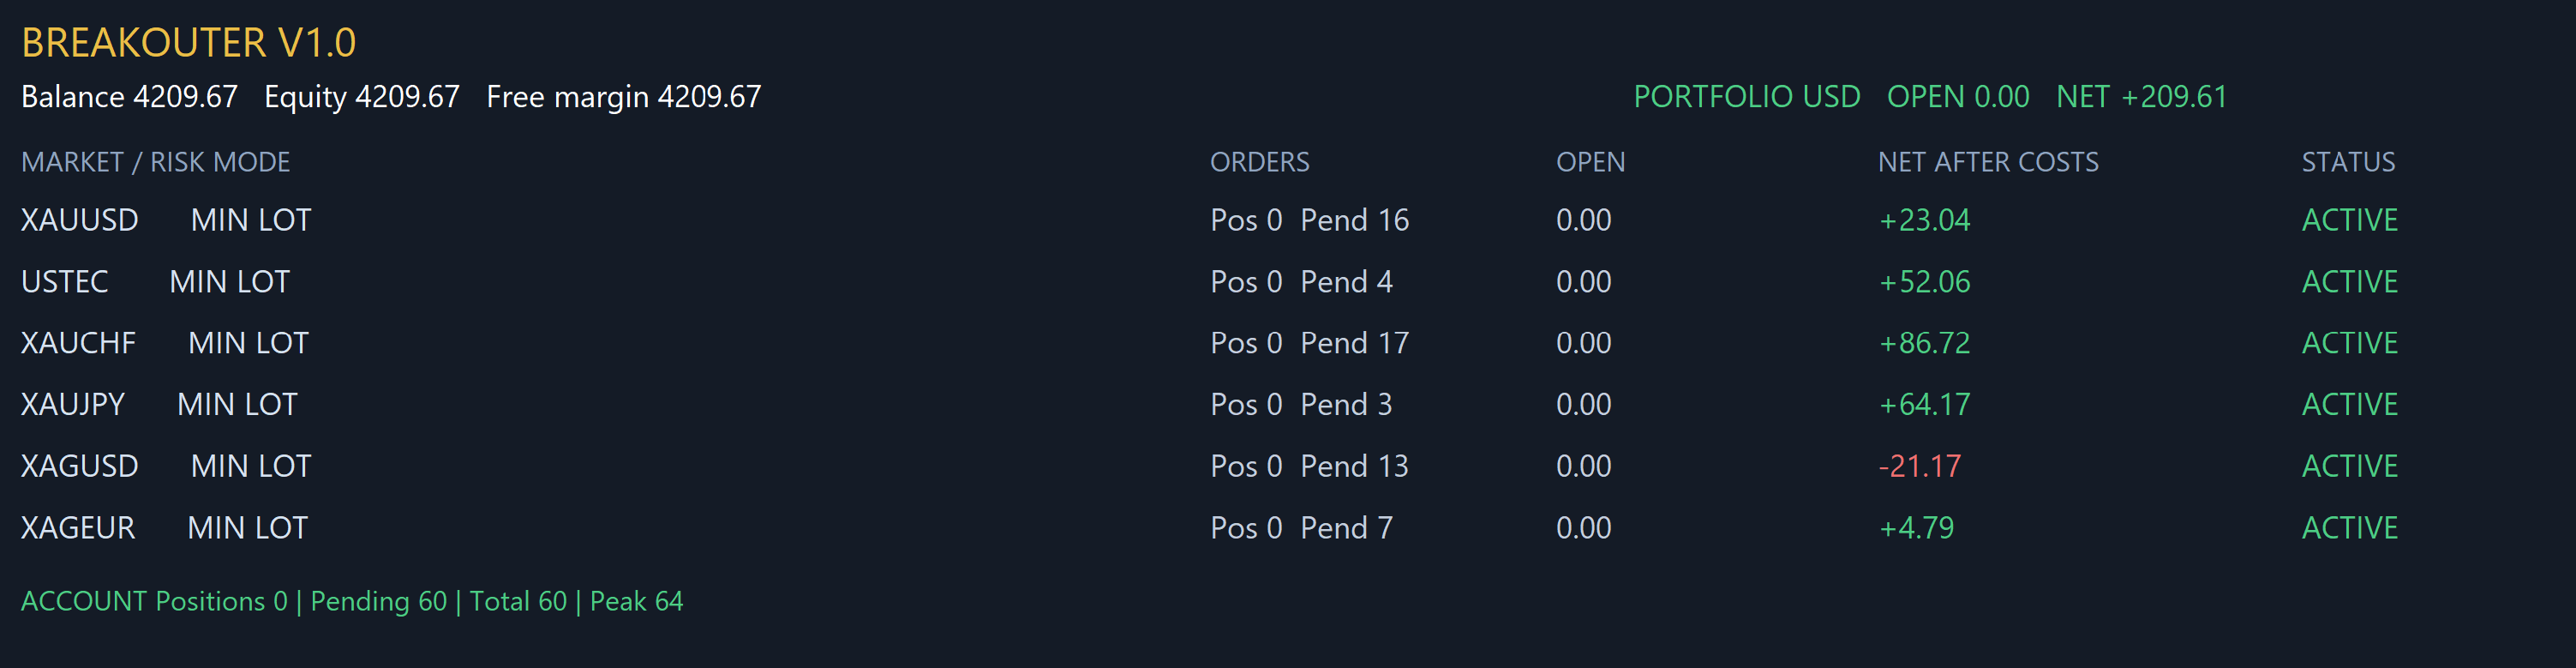
Dashboard snapshot: minimum-lot live account, 4 September 2026.
This is the main conservative public reference. Minimum lot does not mean identical monetary risk on every market. Contract size, tick value and the broker's minimum volume differ between symbols.
Public minimum-lot signal:
Breakouter – Minimum Lot Live Signal
Account 2: Experimental 5% risk per new order
- Starting balance: 1,000.00 USD
- Balance in the dashboard snapshot: 1,244.22 USD
- Net after costs since start: +244.16 USD
- Return based on the dashboard snapshot: +24.42%
- Lot setting: 5% calculated risk per new order
- Snapshot status: 0 open positions, 60 pending orders, peak account order count 64
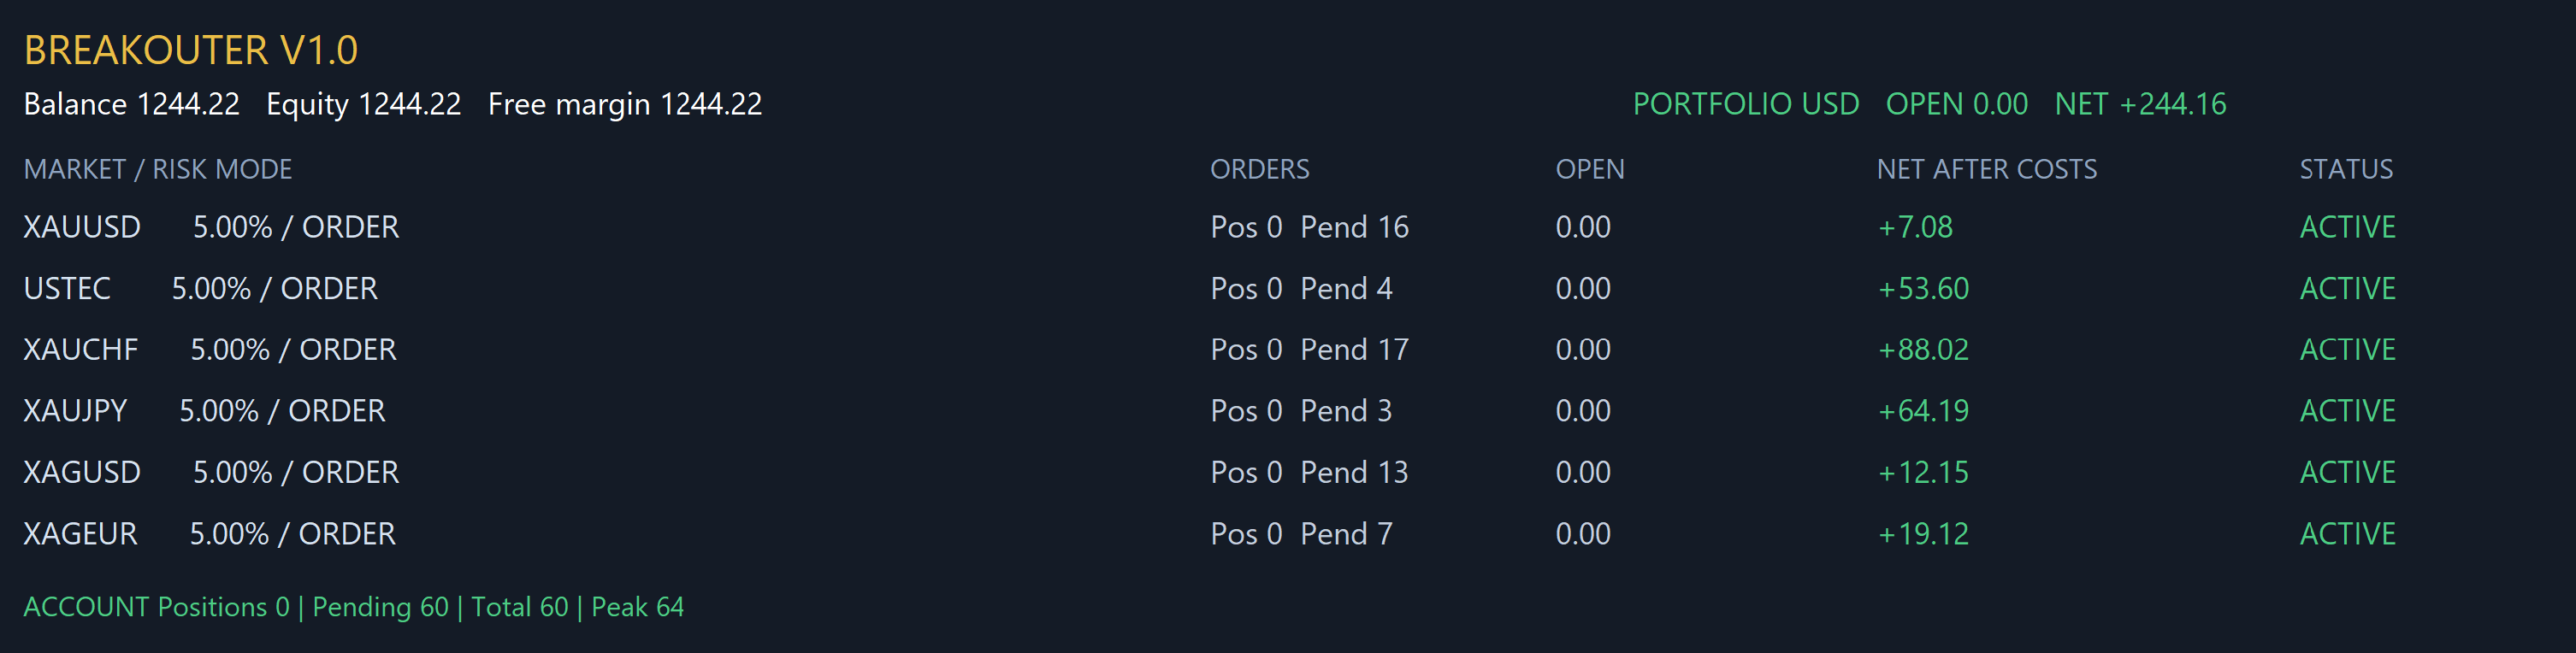
Dashboard snapshot: experimental high-risk live account, 4 September 2026.
This is an aggressive experimental account. Five percent applies to each new order, not to the complete account. Several orders and positions can be active together. Combined exposure, correlated markets, gaps, slippage, spreads and execution can therefore produce an account loss much larger than five percent.
Public experimental signal:
Breakouter High Risk Experimental – Live Signal
Why +5.24% and +24.42% are not a fair performance comparison
The first reason is simple arithmetic. The absolute net results in the two dashboard snapshots are relatively close: +209.61 USD and +244.16 USD. One result is measured against 4,000 USD of starting capital and the other against only 1,000 USD. Similar dollar results therefore create very different percentages.
The second reason is position sizing. Minimum broker lot and percentage risk are different mechanisms. Depending on a symbol's contract specification and minimum volume, a percentage calculation may still be forced up to the minimum tradable lot. On another symbol it may produce a larger position. The risk difference is therefore not a uniform multiplier across all six markets.
The third reason is timing. The accounts did not start at exactly the same moment. A breakout system can enter a different path when it begins with different pending orders, prices or available history. Once the balances diverge, percentage-based sizing changes the following trades again.
What the snapshot does show
At the captured moment both accounts were positive and flat, with no open positions. Both dashboards showed 60 pending orders and a peak account order count of 64. This confirms that the same coordinated portfolio structure was active across XAUUSD, USTEC, XAUCHF, XAUJPY, XAGUSD and XAGEUR.
The symbol breakdown also shows why a portfolio should not be judged from one market alone. On the minimum-lot account, five markets were positive while XAGUSD was negative in the snapshot. The combined portfolio nevertheless remained positive. On the experimental account all six markets happened to be positive at that moment. This can change with the next trades.
What the snapshot does not show is long-term robustness. Two weeks are far too short to estimate expected return, future drawdown or the ability to survive a prolonged adverse phase.
The figures that matter next
- maximum balance and equity drawdown;
- maximum deposit load and minimum margin level;
- simultaneous positions and combined stop risk;
- correlated exposure across gold and silver markets;
- gaps, slippage, spreads, commissions and swaps;
- losing sequences and recovery time;
- whether individual markets contribute consistently or only temporarily.
The return number is the easiest number to notice, but it is not enough to evaluate an automated portfolio. A higher short-term return is meaningful only together with the risk and exposure that produced it.
Why publish both accounts?
The minimum-lot account documents the product's conservative operational baseline. The experimental account makes the effect of aggressive sizing visible in public, including the uncomfortable periods that will eventually occur. Its purpose is observation and transparency, not a recommendation to use five percent risk per order.
The continuously updated signal pages may already show different figures from this dated snapshot. That is expected: live results, equity and open exposure change over time.
If you want to test the six-market portfolio first, this guide explains the required symbol mapping and Strategy Tester setup:
How to Test a Six-Market EA Correctly in the MetaTrader 5 Strategy Tester
Risk notice: Live or historical performance does not guarantee future results. Automated trading can lead to substantial losses or the complete loss of capital. The experimental account is explicitly high risk and is not presented as suitable for every trader.