Why a moving average that "remembers" reads cleaner than one that follows

Most traders put a moving average on the chart to answer one question: which way is this market leaning right now? The problem is that a plain moving average answers a slightly different question — where has price been on average lately — and those two things drift apart exactly when you need clarity the most.
This post is about a small change in how a baseline behaves that makes it much easier to read, and about a second habit — reading two timeframes at once — that turns a single line into a full bias map. I build indicators, and I'll use my own Memory Baseline to show the idea in practice, but the concept stands on its own whatever tool you use.
The problem: a normal average follows every move, then gives the level back
Take a standard moving average through a trend. Price stretches away, the average leans toward it, the move ends — and the average immediately starts sliding back toward the new, quieter price action. That "give it back" behaviour is mathematically correct: an average is supposed to track the recent mean. But for a trader it's noisy. The line that told you "we pushed up here" quietly erases that information a few bars later, and in a range it wobbles around with every candle, flipping your read back and forth on movement that means nothing.
You end up doing one of two things: either you add more smoothing (and now the line lags so badly it's useless at the start of a move), or you accept the wobble and over-trade it.
The idea: hold the level a trend reached
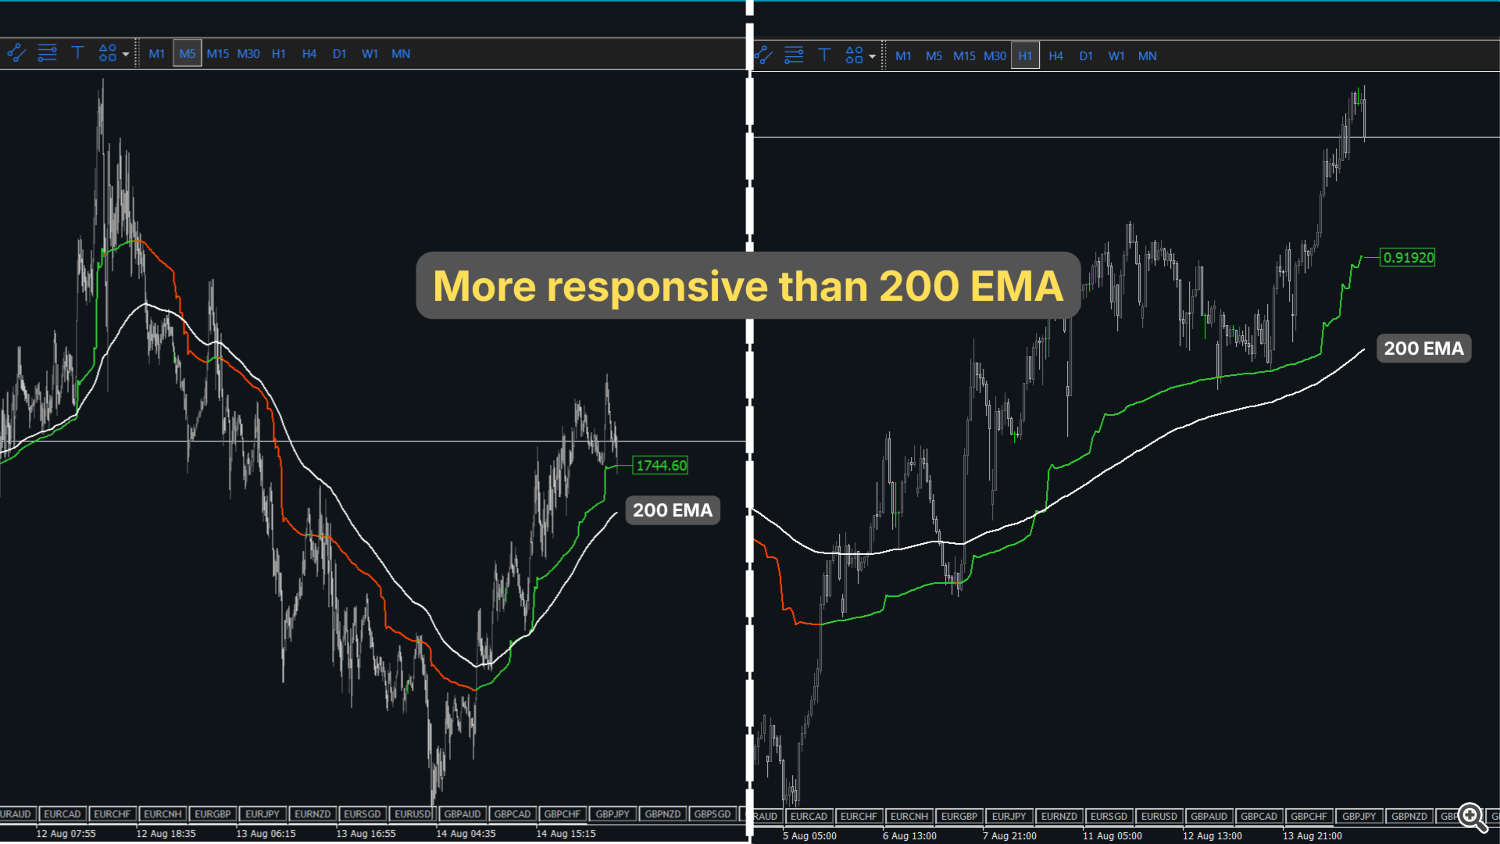
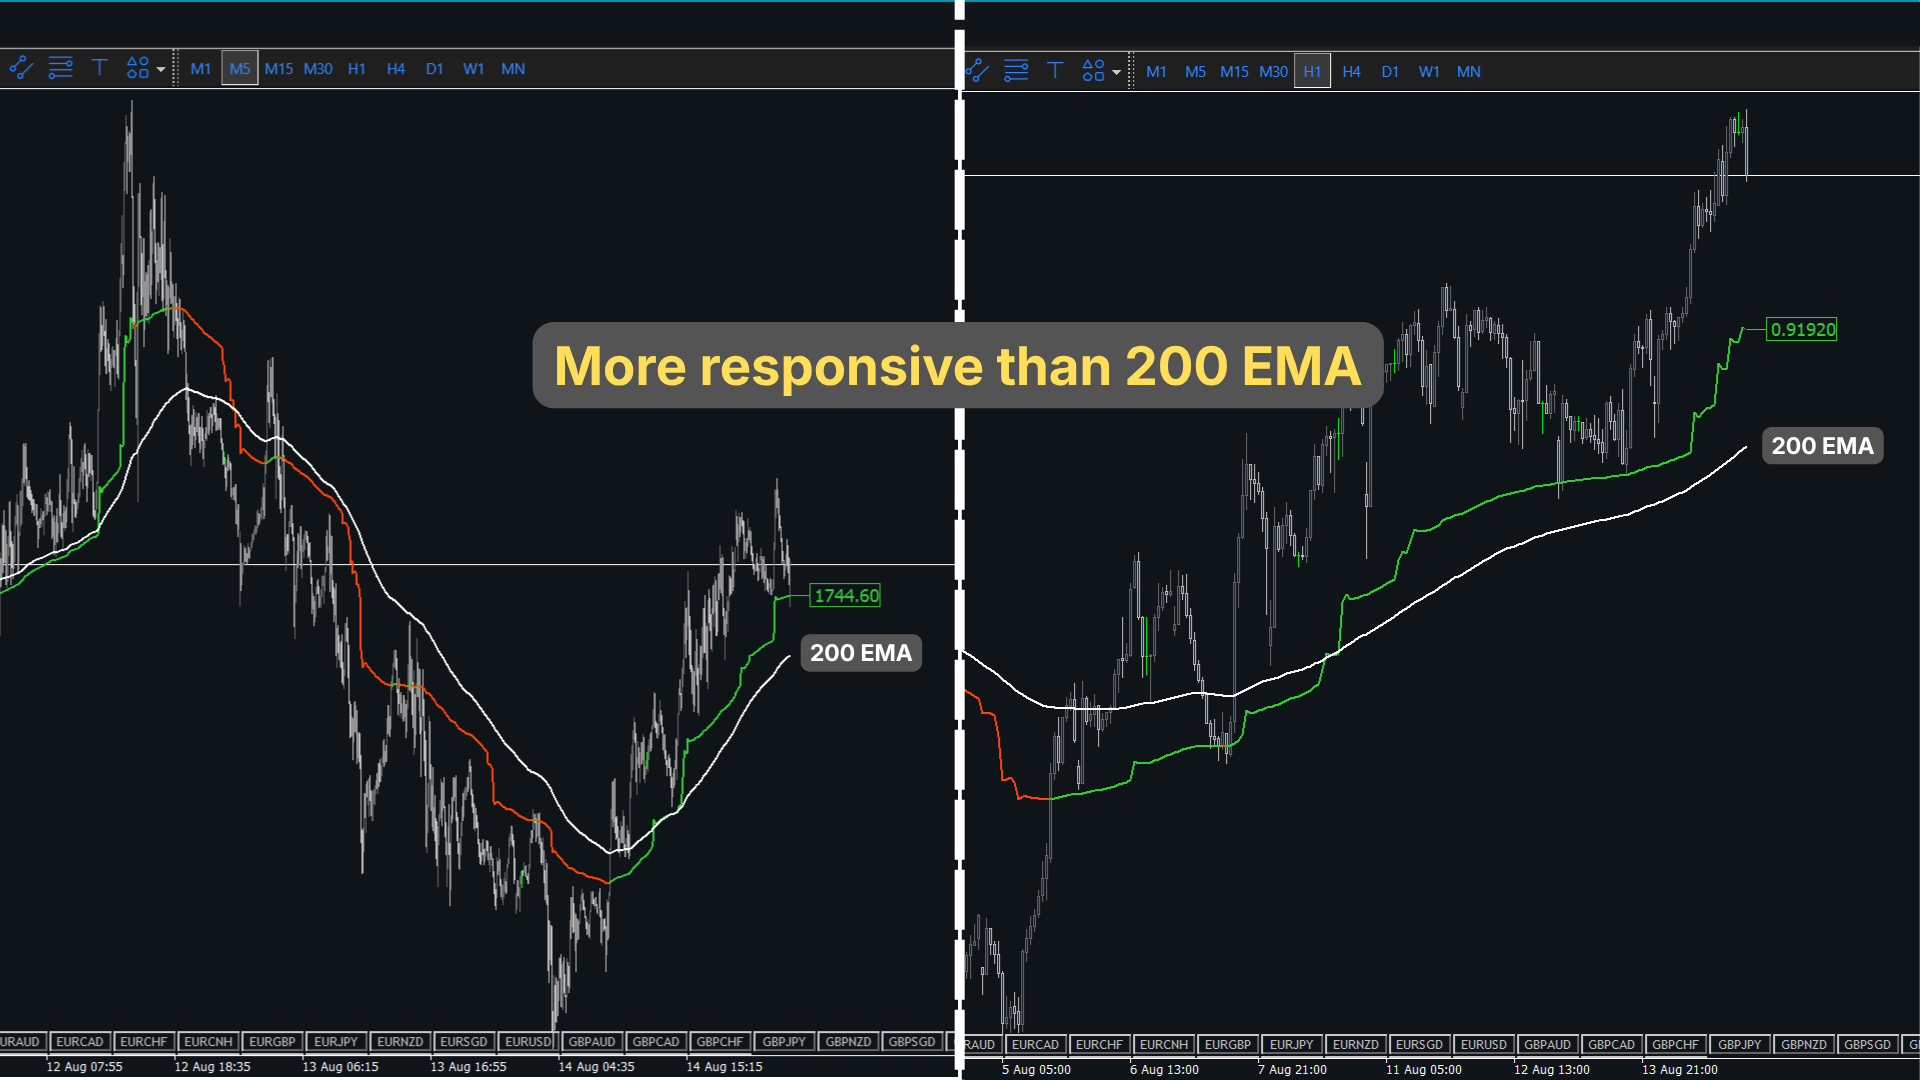
Now picture a baseline that reacts the same way going into a move — it closes the gap to price when a trend genuinely stretches — but when the move is over, it does not snap back. It holds the level it reached and eases off slowly, the way a trend actually cools down rather than instantly reversing.
That "holding" is the memory. Visually it shows up as small plateaus: after each real push the line settles onto a shelf and stays there, instead of melting back toward price. The practical effect is that the line stops reacting to every wick. In a range it sits still because nothing has genuinely stretched; in a trend it steps up (or down) and keeps what it gained. You read direction from the shelf, not from the noise.
This is the whole design behind Memory Baseline: an adaptive average with a rubber-band pull toward price on a real stretch, plus a directional lean, capped so it never runs away from price. When the move stops, the level stays. One clean line, far fewer false flips.
The habit that doubles the value: read two timeframes at once
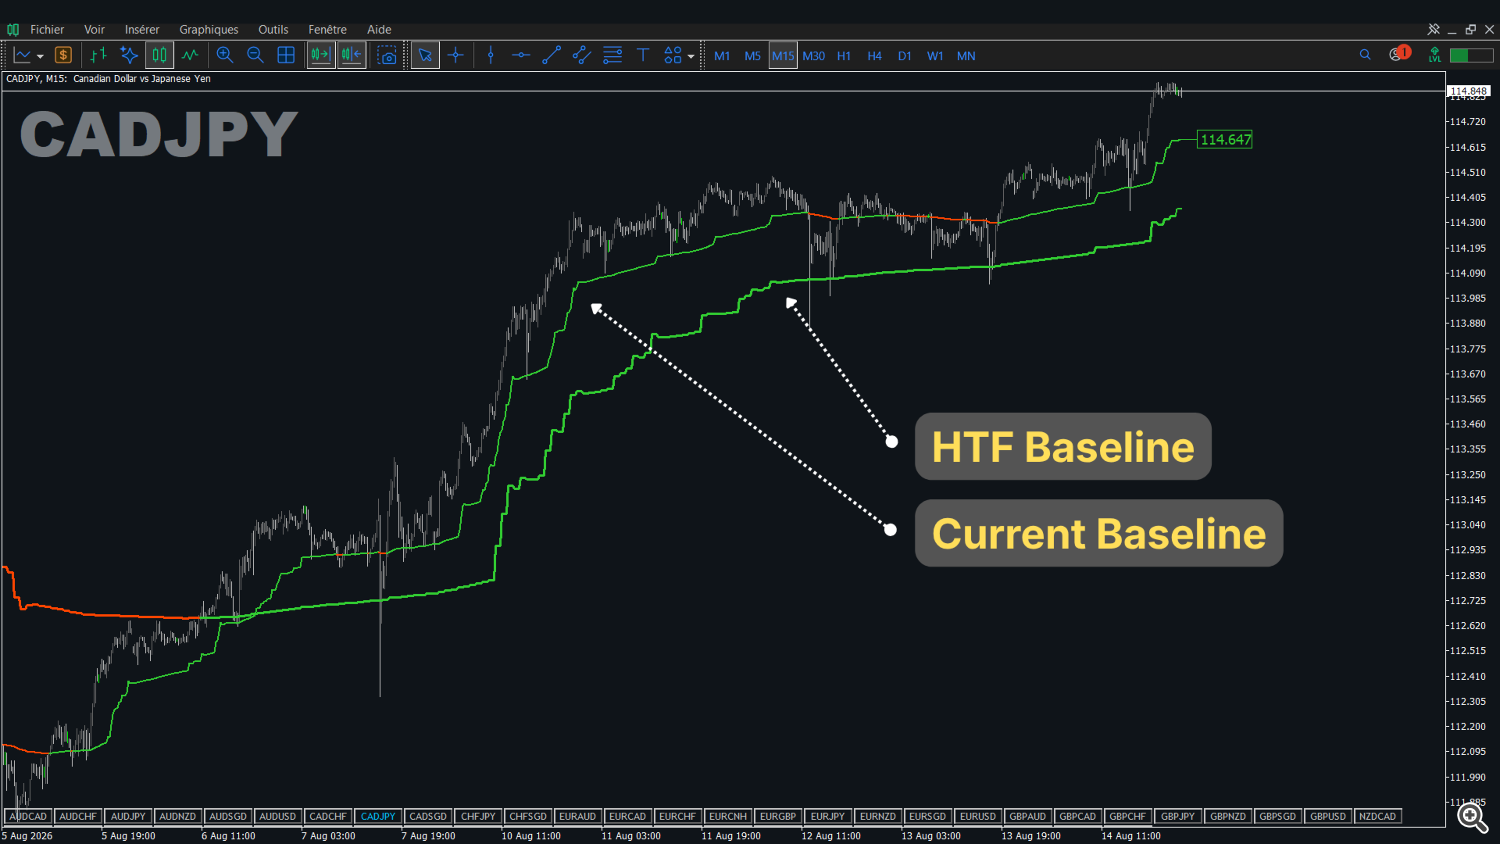
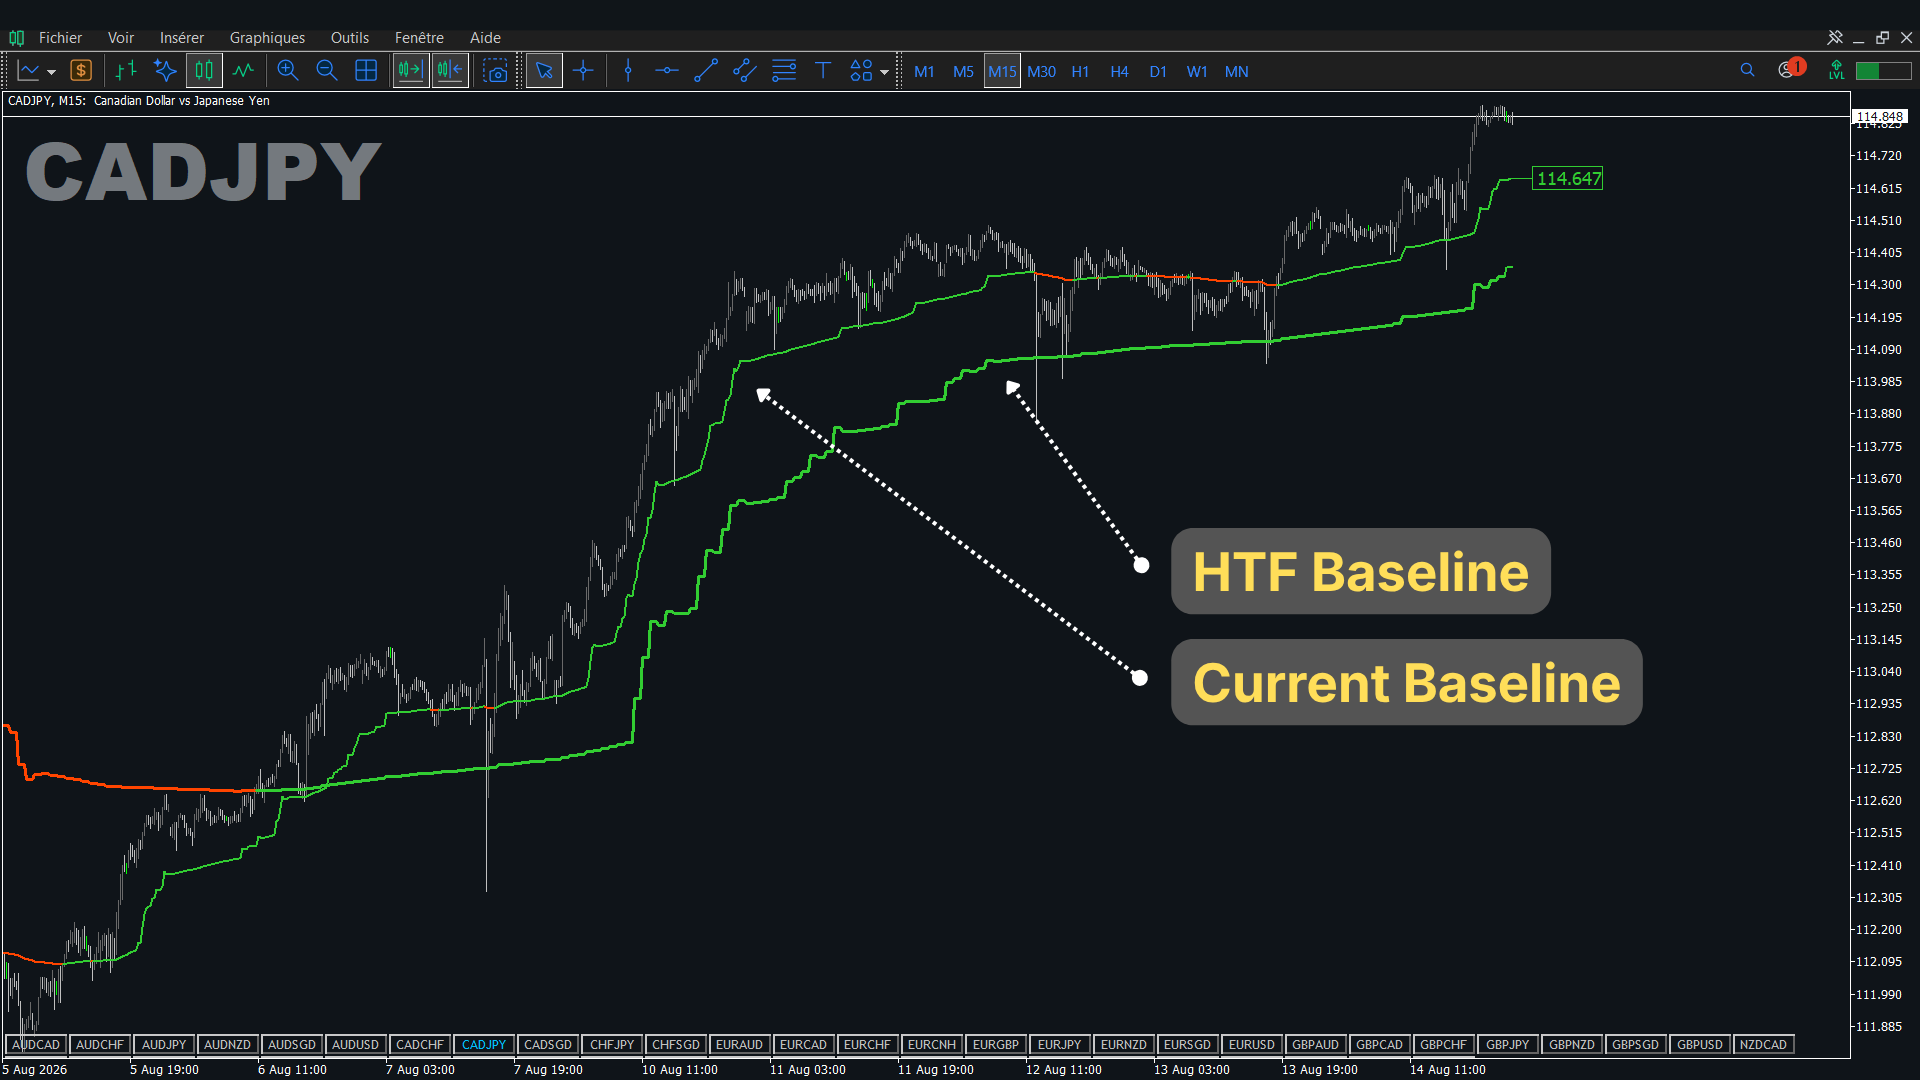
Here's the part that changes how you use a baseline day to day. A single baseline tells you the bias on the timeframe you're looking at. But most losing trades on a good signal aren't wrong about the local move — they're wrong about the bigger picture. You take a clean long on the trading timeframe straight into the teeth of a higher-timeframe downtrend.
The fix is top-down reading: know the higher-timeframe bias before you act on the local one. Traditionally that means flipping between charts, holding the higher timeframe in your head, and hoping you remember it correctly by the time your entry sets up. It's friction, and under pressure people skip it.
So put both on one chart. Memory Baseline can draw a second baseline computed on a higher timeframe, right on top of your trading chart, as a staircase. Your local line gives the fine signal; the higher-timeframe line gives the background bias. The rule becomes simple and visual: trade the local line in the direction of the higher-timeframe one. When they agree, you have alignment. When they fight, you sit on your hands. No chart-flipping, no memory games — the top-down check is just there, in front of you.
How to try the idea
You don't need to buy anything to test whether a "memory" baseline reads cleaner for you. Put a standard moving average on a chart, then watch specifically what it does after a move ends — does it hold the level or give it back? Then ask whether a line that held those levels would have kept you out of the range chop you traded.
If you want the finished version of the idea — the memory behaviour plus the two-baseline top-down overlay on one chart, no repaint, on any pair and any timeframe — Memory Baseline is on my profile, and it ships with a free demo you can run in the Strategy Tester before deciding. Try it on your own charts, on the pairs you actually trade, and see whether the line sits still when it should and moves when it should.
Follow my profile for the tools I release next.
You can find Memory Baseline here: https://www.mql5.com/en/market/product/192061?source=Site+Profile
(For educational and analytical use. Trading involves risk; past behaviour does not guarantee future results.)