QuantMatrix Candle Patterns: How to Read Candlestick Signals Correctly

Candlestick patterns are among the most widely used tools in price action analysis. Patterns such as Hammer, Engulfing, Morning Star and Shooting Star are easy to recognize in theory, but manual identification can become subjective when dozens or hundreds of candles must be analyzed.
QuantMatrix Candle Patterns was created to make this process objective and automatic inside MetaTrader 5.
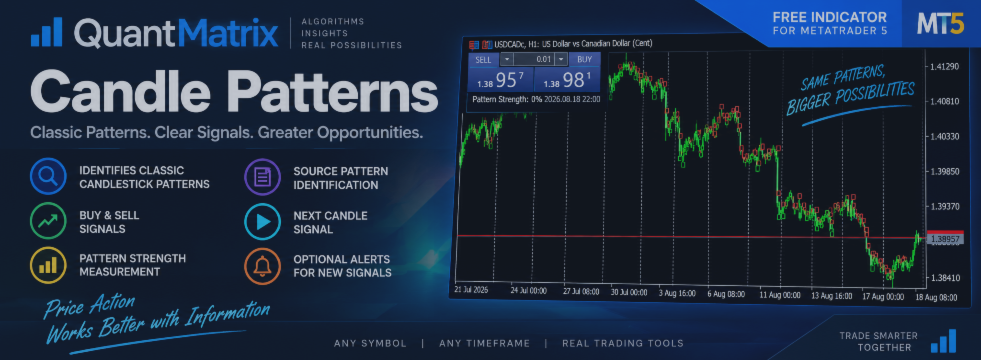
The indicator identifies classical candlestick formations, evaluates their structural quality and displays the corresponding BUY or SELL indication on the candle following the confirmed pattern.
Why Is the Signal Displayed on the Next Candle?
This is one of the most important aspects of the indicator.
A candlestick pattern can only be confirmed after the candle that completes the formation has closed.
For example:
- A Bullish Engulfing formation develops.
- The source candle closes.
- The pattern is confirmed.
- The BUY signal becomes valid from the next candle.
This avoids showing a trading indication before the pattern actually exists.
The panel therefore separates two concepts:
Source Pattern
The candlestick formation detected on the completed candle or candle sequence.
Next Candle Signal
The directional indication generated after that pattern has been confirmed.
Understanding Pattern Strength
The indicator also calculates Pattern Strength.
Pattern Strength measures how closely the detected formation matches the structural characteristics expected from that candlestick pattern.
Depending on the pattern, the calculation can consider factors such as:
- candle body size;
- upper wick size;
- lower wick size;
- relationship between body and total candle range;
- relative size between consecutive candles;
- engulfing proportion;
- candle direction;
- basic previous price context.
A stronger geometrical formation receives a higher Pattern Strength value.
It is important to understand what this number means.
Pattern Strength is not a historical probability of profit.
A Pattern Strength of 80%, for example, does not mean that eight out of ten trades will be profitable. It means that the current formation presents a relatively strong structural match with the rules used to identify that pattern.
Historical probability requires a different type of statistical analysis.
Patterns Detected
QuantMatrix Candle Patterns currently recognizes bullish, bearish and neutral formations including:
Bullish Patterns
- Hammer
- Inverted Hammer
- Bullish Engulfing
- Piercing Line
- Morning Star
- Three White Soldiers
- Tweezer Bottom
- Bullish Marubozu
Bearish Patterns
- Hanging Man
- Shooting Star
- Bearish Engulfing
- Dark Cloud Cover
- Evening Star
- Three Black Crows
- Tweezer Top
- Bearish Marubozu
Contextual and Neutral Patterns
- Doji
- Spinning Top
- Inside Bar
- Outside Bar
Some patterns may require context to determine whether they have bullish, bearish or neutral characteristics.
How to Use the Indicator
After attaching QuantMatrix Candle Patterns to a MetaTrader 5 chart, the indicator automatically analyzes the current symbol and timeframe.
The information panel displays:
Source Pattern
The most recently confirmed formation.
Next Candle Signal
BUY, SELL or NEUTRAL.
Pattern Strength
The structural quality of the formation.
BUY and SELL arrows are also displayed directly on the chart.
The indicator can be used on different symbols and timeframes because its calculations are based mainly on relationships between candle dimensions rather than fixed price distances.
Available Settings
The indicator includes several configurable parameters.
Max Bars To Scan
Defines how many historical candles are analyzed.
Show Panel
Enables or disables the information panel.
Enable Alerts
Generates an alert when a new directional signal is detected.
Doji Body Percent
Controls the maximum relative body size accepted when identifying a Doji.
Marubozu Body Percent
Controls the minimum body proportion required for a Marubozu.
Strong Body Percent
Defines the minimum body proportion used in formations that require strong candles.
Wick Dominance
Controls how dominant a wick must be relative to the candle body when detecting patterns such as Hammer or Shooting Star.
The default settings are designed to provide a practical starting point.
Candlestick Patterns Are Context, Not Certainty
Candlestick formations describe price behavior, but a pattern by itself does not guarantee what the market will do next.
The same Bullish Engulfing pattern may appear:
- after a prolonged decline;
- inside a sideways market;
- during a strong bullish trend;
- close to support;
- during unusually high volatility.
These situations are not equivalent.
For this reason, QuantMatrix Candle Patterns should be viewed as a price action identification tool, not as a substitute for complete market analysis or risk management.
Its main purpose is to answer a simple question objectively:
What candlestick pattern has just formed, and what directional information does that formation provide for the next candle?
That creates a structured starting point for traders who use candlestick analysis while removing much of the subjectivity involved in recognizing formations manually.
QuantMatrix Candle Patterns is available for MetaTrader 5 on the MQL5 Market.



