Rafael Barreto Haddad
  • Rafael Haddad → QuantMatrix → quantitative trading research at Quantitative Trading Systems Researcher
  • Brazil
  • 2152
  • Information
1 year
experience
13
products
4
demo versions
0
jobs
0
signals
0
subscribers
Rafael Haddad → QuantMatrix → quantitative trading research at Quantitative Trading Systems Researcher
X
I am the creator of the QuantMatrix Research Series for MetaTrader 5.

My work focuses on quantitative trading systems, adaptive Expert Advisors and market-analysis tools built around historical evidence, strategy validation and continuous model evaluation.

QuantMatrix research explores areas such as strategy discovery, Champion/Challenger competition, market regimes, historical similarity, probability analysis, volatility, entry timing, robustness and risk-aware execution.

My development philosophy is simple:

Research → Validate → Challenge → Execute → Monitor → Replace when the evidence changes.

I publish free analytical tools, research indicators, Expert Advisors and technical content about systematic and algorithmic trading.

The goal is not to predict every market movement. It is to measure evidence, uncertainty and risk more consistently.

Trading involves risk. Historical results, statistical probabilities and backtests do not guarantee future performance.

Rafael Haddad
Creator, QuantMatrix Research Series
Friends 2
Rafael Barreto Haddad
Published post From Indicator Dashboard to a Testable Trading Decision
<h2 style="margin:26px 0 12px 0; line-height:1.3;">More information can create more discretion</h2><p style="text-align:justify; margin:0 0 16px 0; line-height:1.65;">A dashboard may combine momentum, flow, volatility, divergence and higher-timeframe context...
Rafael Barreto Haddad
Published post How to Build an Audit Trail for an Expert Advisor
<h2 style="margin:26px 0 12px 0; line-height:1.3;">“The robot acted strangely” is not a diagnosis</h2><p style="text-align:justify; margin:0 0 16px 0; line-height:1.65;">When an EA opens, rejects or closes a position, the event should be explainable from recorded state...
Rafael Barreto Haddad
Published post Execution Risk in MetaTrader 5: When Costs Consume the Edge
<h2 style="margin:26px 0 12px 0; line-height:1.3;">The chart price is not the trading result</h2><p style="text-align:justify; margin:0 0 16px 0; line-height:1...
Rafael Barreto Haddad
Published post When Should You Suspend a Trading Model?
<h2 style="margin:26px 0 12px 0; line-height:1.3;">Loss is not automatically failure</h2><p style="text-align:justify; margin:0 0 16px 0; line-height:1.65;">Every strategy has losing trades and uncomfortable sequences...
Rafael Barreto Haddad
Published post Monte Carlo Analysis for Traders: Stress the Path, Not Just the Result
<h2 style="margin:26px 0 12px 0; line-height:1.3;">One backtest contains one sequence</h2><p style="text-align:justify; margin:0 0 16px 0; line-height:1.65;">The historical report shows wins and losses in the order they happened...
Rafael Barreto Haddad
Published post How Much Data Is Enough to Trust a Trading Strategy?
<h2 style="margin:26px 0 12px 0; line-height:1.3;">There is no universal minimum</h2><p style="text-align:justify; margin:0 0 16px 0; line-height:1...
Rafael Barreto Haddad
Published post A Trading Robot Is a Living Monitoring Process
<h2 style="margin:26px 0 12px 0; line-height:1.3;">Deployment is not the end of research</h2><p style="text-align:justify; margin:0 0 16px 0; line-height:1...
Rafael Barreto Haddad Published product

QuantMatrix Volume Depth is a MetaTrader 5 indicator for visual analysis of market activity across different price levels. The indicator builds a horizontal profile across the analyzed price range and shows where trading activity has been concentrated. It displays the Point of Control, Value Area High, Value Area Low and the distribution of activity across multiple price levels. The indicator can use real volume when it is available from the symbol. When real volume is not available, tick volume

Rafael Barreto Haddad Published product

QuantMatrix Prism Structure is a MetaTrader 5 indicator for visual analysis of market structure. It identifies confirmed swing highs and swing lows and displays structural information directly on the chart. The indicator can display higher highs, higher lows, lower highs, lower lows, structure changes, fair value gap areas and ATR based information. A chart panel summarizes the current structure state, recent structural events and relevant market information. The indicator is intended for

Rafael Barreto Haddad
Before optimizing a strategy, define what would make you reject it.

A high profit factor is not enough if the result depends on one month, one symbol, one spread assumption, or a handful of trades. I prefer to write the failure conditions first: maximum tolerable drawdown, minimum trade count, cost sensitivity, parameter stability, and acceptable degradation out of sample.

This changes optimization from “find the best settings” into “search for configurations that survive reasonable stress.”

What is the first condition that makes you reject a backtest?
Rafael Barreto Haddad
Candlestick patterns are among the most widely used tools in price action analysis. Patterns such as Hammer, Engulfing, Morning Star and Shooting Star are easy to recognize in theory, but manual identification can become subjective when dozens or hundreds of candles must be analyzed...
Rafael Barreto Haddad
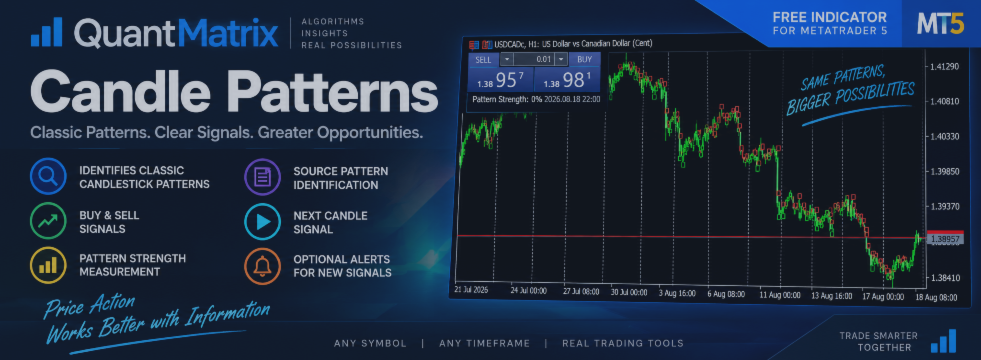
QuantMatrix Candle Patterns is now available for MetaTrader 5.

The indicator automatically identifies classic candlestick formations and displays the corresponding BUY or SELL signal on the following candle, only after the source pattern has been confirmed.

It includes:

• Bullish and bearish candlestick patterns
• BUY and SELL signals
• Pattern Strength measurement
• Source Pattern identification
• Next Candle Signal display
• Optional alerts
• Support for any symbol and timeframe

Pattern Strength represents the structural quality of the detected formation. It is not a historical probability of profit.

QuantMatrix Candle Patterns is available free on the MQL5 Market.

#MQL5 #MetaTrader5 #CandlestickPatterns #PriceAction #TradingIndicators #QuantMatrix
Rafael Barreto Haddad Published product

QuantMatrix Candle Patterns is a free MetaTrader 5 indicator designed to identify classic candlestick formations directly on the chart. The indicator analyzes completed candles and detects recognized bullish, bearish and neutral price-action patterns. When a valid bullish or bearish formation is confirmed, the corresponding BUY or SELL signal is displayed on the following candle . This means the signal is only generated after the source pattern has been completed. The indicator also displays a

Rafael Barreto Haddad Published product

QM Candle Timing Meter is a free MetaTrader 5 indicator designed to answer one simple question: How late am I in the current candle? A trading signal may still be technically valid while the timing of the entry has already changed significantly. For example, entering during the first minutes of an H1 candle is very different from entering when 90% of that candle has already elapsed. QM Candle Timing Meter continuously measures the temporal position of the current candle and displays this

Rafael Barreto Haddad
A valid signal does not always mean a valid entry

One detail can significantly change the behavior of a trading strategy:

the moment when the trade is actually entered.

Imagine an M15 strategy generates a BUY condition shortly after a new candle begins.

If the entry happens during the first 10% of the candle:

the movement may only be starting;
the entry may still be close to the original signal;
much of the candle's potential range may still be ahead;
the distance to invalidation may remain relatively small.

Now imagine taking exactly the same BUY condition when 85% of the candle has already elapsed.

The technical condition may still be true.

The moving average may still be bullish.
Momentum may still be positive.
Price may still be above the breakout level.

But the trade is no longer identical.

A large part of the current movement may already have happened.

This creates an important distinction:

Signal state ≠ entry event

A condition can remain active long after the event that originally created the opportunity.

Consider a moving-average crossover.

If the fast average crossed above the slow average 20 candles ago, the fast average may still be above the slow average today.

That tells us something about the current market state.

But it does not automatically mean that opening a new trade today is statistically equivalent to entering when the crossover happened.

The same problem exists inside a single candle.

An entry made during the first 10% of an M15 candle should not automatically be treated as equivalent to an entry made during its final 10%.

Possible differences include:

entry price;
remaining movement;
distance to invalidation;
short-term exhaustion;
available reward relative to risk;
volatility already consumed by the candle.

This is why timing deserves to be measured separately from direction.

A simple analytical framework is to divide the candle into temporal zones:

0–25% — Early
25–50% — Developing
50–75% — Late
75–100% — Very Late

These percentages are not universal trading rules.

They are measurement zones.

The more useful question is not simply:

“Is the BUY condition still true?”

It is:

“Is this still the same entry opportunity that produced the historical behavior of the strategy?”

This distinction is part of the research behind QuantMatrix.

It is also the idea behind the free QM Candle Timing Meter, a MetaTrader 5 tool designed to measure how much of the current candle has already elapsed.

The indicator does not predict direction and does not generate BUY or SELL signals.

Its purpose is simpler:

measure timing before timing becomes an unnoticed variable in the trade.

Research → Validate → Challenge → Execute → Monitor → Adapt

Rafael Haddad
QuantMatrix Research Lab

Historical observations, probabilities and analytical tools do not guarantee future trading performance.
12