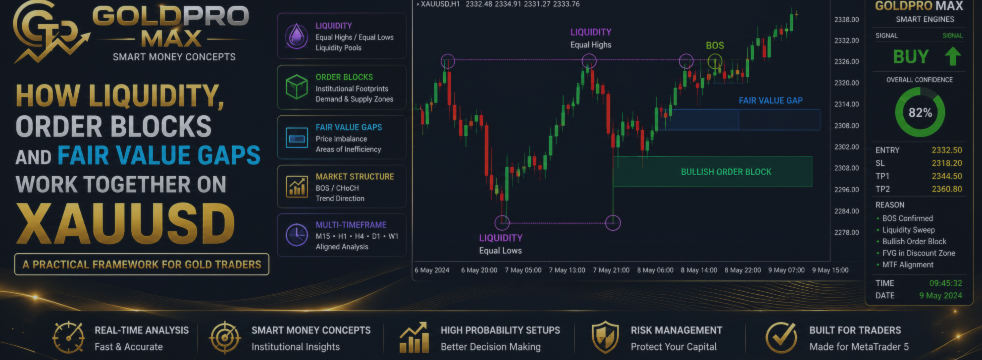
How Liquidity, Order Blocks and Fair Value Gaps Work Together on XAUUSD (" GoldPro Max " Indicator link end of page)

A Practical Smart Money Framework for Gold Traders
Gold (XAUUSD) can move quickly and often creates situations where a simple indicator is not enough to understand what price is doing.
One useful approach is to study the relationship between Liquidity, Order Blocks and Fair Value Gaps (FVGs) together with market structure and higher-timeframe confirmation.
Instead of treating each concept as an isolated signal, traders can use them as parts of a structured market-analysis framework.
In this article, we will look at how these concepts can work together when analyzing XAUUSD.
1. Liquidity — Where Price May Be Attracted
Liquidity can be viewed as areas where significant numbers of orders may be concentrated.
Common examples include:
- Equal Highs
- Equal Lows
- Previous Swing Highs
- Previous Swing Lows
- Session Highs and Lows
- Important support and resistance areas
These levels are important because price may interact with them before continuing or changing direction.
Example
Imagine that XAUUSD creates two similar highs.
These highs can become an area traders watch closely.
Price may move above the previous highs, trigger orders around that area, and then either:
Continue higher
or
Reverse back into the previous range.
This is why simply seeing a liquidity level does not automatically mean BUY or SELL.
The surrounding market structure matters.
2. Order Blocks — Areas of Interest
Order Blocks are commonly used within Smart Money Concepts to identify areas where price may react after a significant market movement.
A bullish Order Block may be associated with a strong upward displacement.
A bearish Order Block may be associated with a strong downward displacement.
However, not every Order Block should automatically be treated as a trading signal.
A trader can evaluate additional factors such as:
- Higher-timeframe trend
- Market structure
- Liquidity
- Price displacement
- FVG presence
- Premium or Discount position
- Price reaction when the zone is revisited
This creates a more structured way of evaluating potential setups.
3. Fair Value Gaps — Understanding Imbalance
A Fair Value Gap is commonly used to describe a price imbalance created during a strong directional move.
When price moves rapidly, an area of inefficient price delivery may appear between candles.
Traders often monitor these areas because price can later return to them.
An FVG by itself, however, should not automatically be considered a BUY or SELL signal.
Its location is important.
For example:
FVG + Bullish Structure + Discount Zone
can provide a different context from:
FVG + Bearish Structure + Premium Zone.
The same technical concept can therefore have completely different meaning depending on the surrounding market conditions.
4. The Real Advantage: Combining the Three
This is where the analysis becomes more interesting.
Instead of asking:
"Is there an Order Block?"
A more structured approach is to ask:
Where is the liquidity?
What is the current market structure?
Is there an Order Block nearby?
Is there an FVG?
Where is price relative to the current range?
Does the higher timeframe agree with the setup?
The objective is not to make every individual component generate a trade.
The objective is to understand whether several pieces of market information are pointing toward the same scenario.
5. A Practical XAUUSD Example
Consider a hypothetical bullish scenario.
XAUUSD is showing a bullish structure on the higher timeframe.
Price then moves lower toward a previous liquidity area.
During the decline, price approaches a bullish Order Block located inside a Discount Zone.
A Fair Value Gap is also present nearby.
Price then reacts from the area and begins creating higher highs.
Now we have several pieces of information:
Higher-Timeframe Bias
Bullish
Liquidity
Sell-side liquidity has been reached
Order Block
Bullish area of interest
FVG
Nearby imbalance
Premium/Discount
Price is in Discount
Market Structure
Bullish reaction
This does not guarantee that price will rise.
But it provides a much more structured context for analysis than relying on a single indicator.
6. Why Multi-Timeframe Analysis Matters
A setup that looks attractive on one timeframe can look completely different on another.
For example:
M15: Bullish
H1: Bullish
H4: Bullish
D1: Neutral
This provides a different context from:
M15: Bullish
H1: Bearish
H4: Bearish
D1: Bearish
The lower timeframe may show a temporary upward movement while the larger market structure remains bearish.
This is why Multi-Timeframe Analysis can help traders place individual setups into a broader context.
7. From Individual Signals to an Analytical Framework
A professional workflow does not necessarily need dozens of separate indicators.
Instead, traders can organize the analysis into several categories:
Market Structure
- BOS
- CHoCH
- Swing structure
- Directional bias
Smart Money Concepts
- Liquidity
- Order Blocks
- Fair Value Gaps
Price Position
- Premium
- Equilibrium
- Discount
Multi-Timeframe Analysis
- Lower timeframe
- Trading timeframe
- Higher timeframe
Signal Evaluation
- Direction
- Confluence
- Confidence
- Risk/Reward context
The purpose is to create a structured decision-support process.
8. GoldPro Max — Bringing the Analysis Together
This is the concept behind GoldPro Max for MetaTrader 5.
Instead of requiring traders to manually monitor multiple analytical components across the chart, GoldPro Max is designed to organize several market-analysis concepts within one environment.
Depending on the enabled features, the indicator can provide analysis related to:
- Multi-Timeframe Analysis
- Smart Money Concepts
- Market Structure
- Liquidity
- Order Blocks
- Fair Value Gaps
- Premium & Discount Zones
- BUY / SELL / WAIT conditions
- Historical Signals
- Confidence Analysis
- Professional Dashboard
The objective is not to replace the trader's judgment.
It is to provide a clearer analytical framework so the trader can evaluate the market with more information and better organization.
9. Confidence Is Not a Prediction
One important distinction should always be made.
A confidence percentage is not a guarantee that price will move in a particular direction.
Markets are uncertain.
A confidence framework can be used as a decision-support metric based on the conditions detected by the analytical system.
For example, several aligned conditions may produce a stronger setup than a situation where the analytical components disagree.
The trader should still consider:
- Risk management
- Position sizing
- Market volatility
- News events
- Spread and execution conditions
- Personal trading strategy
10. A Simple Checklist for XAUUSD
Before considering a setup, ask:
Market Structure
Is the current structure bullish, bearish or neutral?
Liquidity
Where are the important highs and lows?
Order Block
Is there a relevant Order Block near the current price?
FVG
Is there an imbalance that supports the scenario?
Premium / Discount
Is price located in an area that makes sense for the intended direction?
MTF
Do the relevant timeframes agree?
Risk
Where would the setup become invalid?
Confirmation
Are enough conditions aligned to justify further consideration?
This checklist can help turn a chart into a structured analysis instead of a collection of isolated signals.
Conclusion
Liquidity, Order Blocks and Fair Value Gaps become more useful when they are analyzed together with market structure and Multi-Timeframe context.
The goal is not to predict every movement in XAUUSD.
The goal is to understand the market environment, identify areas of interest, evaluate confluence and make more structured trading decisions.
For traders who want to explore this approach directly inside MetaTrader 5, GoldPro Max brings multiple analytical concepts into one professional environment.
Explore GoldPro Max on MQL5 Market
Important Risk Notice
GoldPro Max is an analytical and decision-support tool.
It does not guarantee profits or predict future market movements with certainty.
Trading financial markets involves substantial risk. Always use appropriate risk management and consider testing any trading tool on a demo account before using real funds.
Analyze the structure.
Read the liquidity.
Confirm the timeframes.
Evaluate the setup.