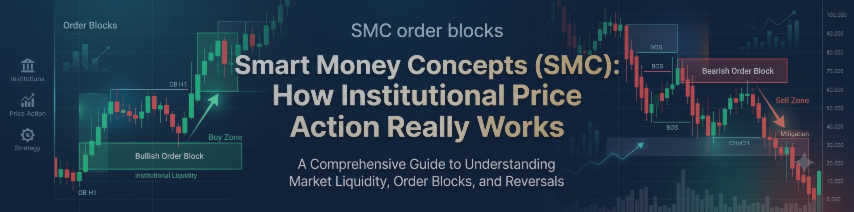
Smart Money Concepts (SMC): How Institutional Price Action Really Works

Every retail trader eventually hits the same wall: indicators that lag, signals that repaint, and setups that look perfect in hindsight but fall apart in real time. The reason is simple — most retail tools are built around lagging math (moving averages, oscillators, indicator crossovers) while the market itself is driven by something else entirely: liquidity and order flow.
That's what Smart Money Concepts (SMC) tries to read directly. Instead of asking "what did price do?", SMC asks "why did price do it — and who made it happen?"
This post breaks down the core building blocks of SMC, why they matter, and how they fit together into a repeatable trading framework.
What Is Smart Money Concepts?
Smart Money Concepts is a price-action methodology built on the idea that markets move because large participants — banks, funds, market makers — need to fill enormous orders without moving price against themselves. They can't just click "buy" on a billion-dollar position; they have to engineer liquidity, accumulate positions quietly, and then drive price in their intended direction once they're positioned.
SMC gives traders a vocabulary and a map for spotting the footprints of that process:
- Market structure — how trend and reversals are defined
- Order Blocks (OB) — the exact candles where institutional orders were likely placed
- Fair Value Gaps (FVG) — imbalances left behind by aggressive, one-sided moves
- Liquidity pools / Strong-Weak highs & lows — where stop-losses and pending orders cluster
None of this is magic. It's a structured way of reading candle-by-candle behavior instead of relying on a lagging formula.
1. Market Structure: BOS and CHoCH
Structure is the backbone of SMC. Every SMC trader needs to know, at a glance, whether the market is trending or reversing — and structure breaks tell you exactly that.
- BOS (Break of Structure) — price breaks the most recent swing high (in an uptrend) or swing low (in a downtrend), confirming the existing trend is continuing.
- CHoCH (Change of Character) — price breaks structure in the opposite direction of the prevailing trend, the first clue that a reversal may be underway.
Serious SMC analysis also separates structure into two layers:
- Swing structure — the major highs/lows that define the higher-timeframe trend
- Internal structure — smaller, short-term pivots that shift inside the swing range, useful for timing entries
Reading both layers together is what lets traders catch early reversals (via internal CHoCH) while staying aligned with the bigger picture (via swing BOS).
2. Order Blocks: Where Smart Money Entered
An Order Block is the last opposing candle before a strong structural break. In plain terms: right before price explodes higher and breaks structure, there's usually one last down-candle — that candle is where institutional buy orders were likely absorbed before the move.
Order blocks matter because price frequently returns to "mitigate" them before continuing in its original direction. That return is a high-probability zone to look for entries, since it represents the same price level where large orders were originally filled.
Key details that separate a good OB read from a guess:
- Zone quality — the block's range (often split into a "premium" upper/lower half and an "extended" zone) tells you where inside the OB price is most likely to react
- Mitigation — once price closes back through an OB, it's generally considered invalidated and should be removed from your chart
- Swing OBs vs Internal OBs — swing-based order blocks tend to be higher-probability, longer-lasting zones, while internal OBs are shorter-term and more reactive
3. Fair Value Gaps: Imbalance in the Market
A Fair Value Gap forms when a strong, aggressive candle leaves a visible gap between the wicks of the candles surrounding it — a three-candle pattern where the first candle's high (or low) doesn't overlap with the third candle's low (or high). This gap represents inefficient pricing: the market moved so fast that it left orders unfilled behind it.
Price has a strong statistical tendency to return and "fill" at least part of this gap before continuing its move. That makes FVGs another key confluence zone, often used alongside order blocks to build higher-conviction entries.
4. Liquidity: Strong and Weak Highs/Lows
Every recent swing high and low is a magnet for liquidity — stop-losses sitting above resistance, stop-losses sitting below support, and pending breakout orders clustered at both. SMC traders classify these levels as:
- Strong high/low — a level that's likely to hold and reverse price, because it represents the origin of the current trend
- Weak high/low — a level that's likely to be swept (taken out) before the market reverses, because it hasn't yet been tested since the last liquidity grab
Understanding which levels are "strong" vs "weak" helps explain why price often makes one more push to grab liquidity before reversing — the classic "stop hunt" retail traders complain about, which is really just smart money collecting the liquidity it needs to fill large orders.
Why SMC Matters More Than Ever
- It explains price instead of just describing it. Indicators like RSI or MACD tell you what happened. SMC gives you a hypothesis for why it happened — which makes your analysis far more adaptive to changing conditions.
- It works across every timeframe and asset. The same structure/OB/FVG/liquidity logic applies to XAUUSD, EURUSD, indices, or crypto, on M5 or H4 charts alike.
- It gives you objective invalidation levels. An order block or a structure level gives you a precise stop-loss location tied to market logic, not an arbitrary ATR multiple.
- It combines naturally with multi-timeframe analysis. Reading HTF structure for bias and LTF structure for entries is one of the most common — and effective — ways professional SMC traders build a trading plan.
The Challenge: SMC Is Hard to Do By Hand
Here's the catch — everything above requires constant, disciplined chart-reading. Manually tracking swing vs internal structure, drawing and updating order block zones, spotting fair value gaps, and re-checking strong/weak levels across two timeframes is genuinely time-consuming, and easy to get wrong under pressure.
That's exactly the gap an automated SMC tool is meant to close: plotting BOS/CHoCH, order blocks, FVGs, and strong/weak levels in real time, on both your entry timeframe and a higher timeframe, so you can focus on decision-making instead of manual chart-marking.
If you want to see this applied directly on your own charts, I've built a Smart Money Concepts indicator for MetaTrader 5 that automates everything covered in this post — structure breaks, dual-layer order blocks, fair value gaps, and strong/weak level tracking, across multiple timeframes at once. You can check it out here:
https://www.mql5.com/en/market/product/184224
Final Thoughts
Smart Money Concepts isn't a magic signal generator — it's a framework for understanding why price moves the way it does. Structure tells you the trend, order blocks and FVGs tell you where price is likely to react, and liquidity levels tell you where the next move is likely to come from. Put together, they form a complete, logical way to read any chart, on any timeframe, in any market.
Whether you trade it manually or with the help of an indicator, understanding these concepts will change the way you look at candlesticks for good.
BY Strategy — Smart Money Concepts MTF (Structure + Order Blocks + FVG) - https://www.mql5.com/en/market/product/184224https://www.mql5.com/en/market/product/184224