
The STRAT Made Simple: Turn 1–2–3 Price Action into Real Trades on MT5

If you’ve ever stared at a chart covered in indicators and thought, “There has to be a simpler way,” Rob Smith’s STRAT is probably what you were looking for the whole time.
And if you’re using our MQL5 STRAT Price Action Scanner indicator, this blog is here to connect the dots
What is The STRAT?
The STRAT is a price-action trading method created by Rob Smith. Instead of relying on moving averages, oscillators, or a pile of indicators, it focuses almost entirely on what each candle did relative to the previous one, plus:
-
How price moves across multiple timeframes
-
Whether all your timeframes are pointing in the same direction (timeframe continuity)
At its core, The STRAT reduces the entire market into just three candle types and the patterns they form. Once you understand those building blocks, everything else becomes pattern recognition and context.
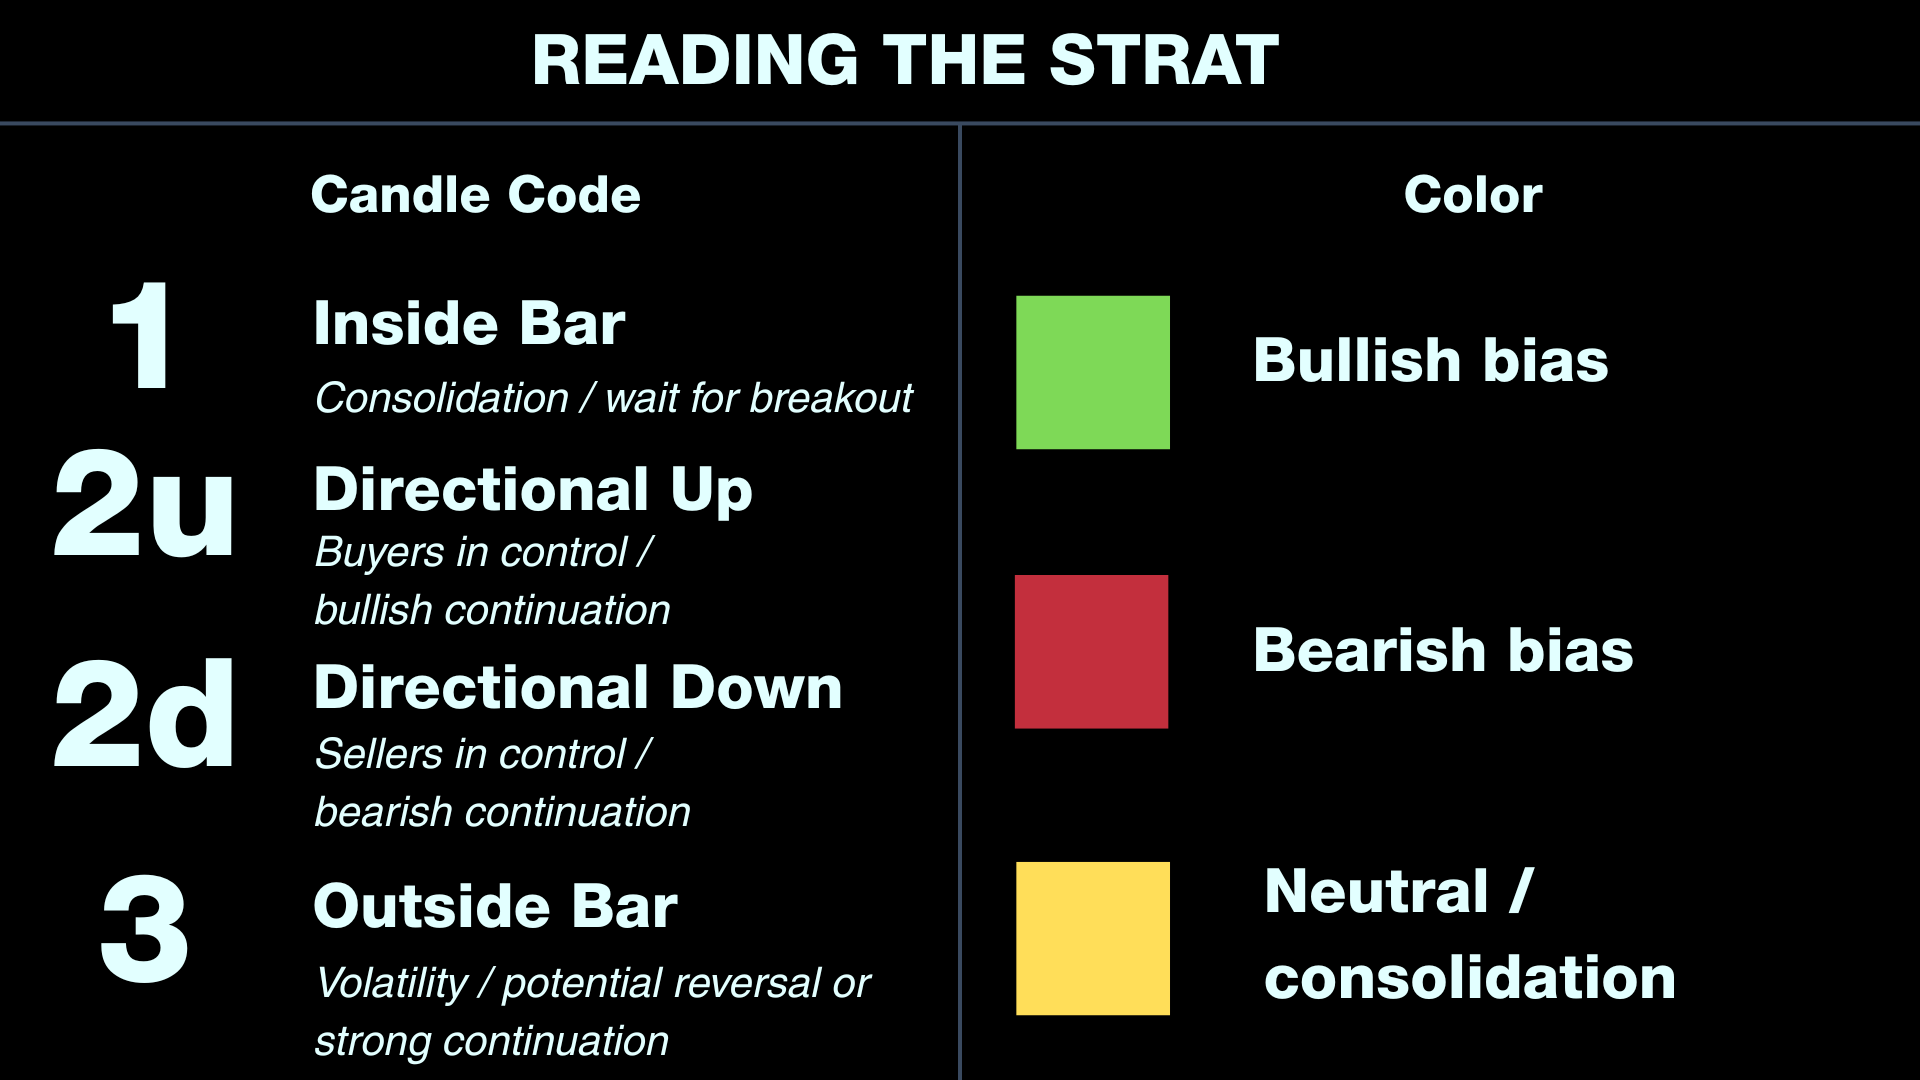
The Three STRAT Scenarios: 1, 2, and 3
Every candle in The STRAT gets one of three labels:
1 – Inside Bar
-
The current candle’s high and low are inside the previous candle’s range.
-
It represents consolidation and a moment of balance.
-
STRAT traders treat it as a coiled spring: whichever way it breaks, that’s your information.
2 – Directional Bar (2U or 2D)
A directional bar takes out one side of the previous candle:
-
2U (Directional Up) – The current candle trades above the previous high, but doesn’t take out the low.
-
2D (Directional Down) – The current candle trades below the previous low, but doesn’t take out the high.
This is the engine of trend: it shows continuation in one direction.
3 – Outside Bar
-
The current candle takes out both the high and low of the previous candle.
-
It shows expansion and volatility – price “broadens out”, sweeping both sides.
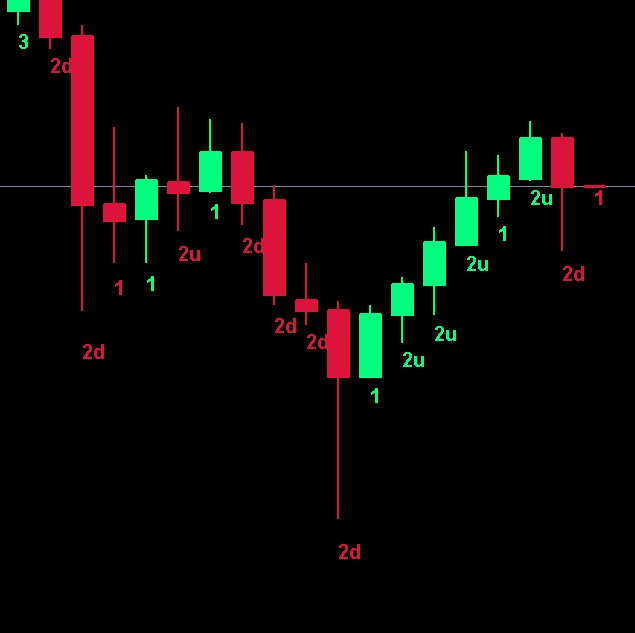
From Single Bars to STRAT Combos
On their own, 1/2/3 are just candles. The magic happens when you link them:
-
2-1-2 Reversal
-
A directional move (2)
-
Then an inside pause (1)
-
Then another directional candle (2) in the opposite direction → Classic reversal or continuation pattern depending on context.
-
-
3-1-2 Reversal
-
A big expansion (3)
-
Then balance (1)
-
Then a decisive 2 in the chosen direction → Often used to catch sharp reversals after volatility.
-
There are many more combos (2-2-2, 3-2-2, etc.), but the idea is the same:
You’re reading how price went from expansion → pause → expansion again, and you trade in line with that story.
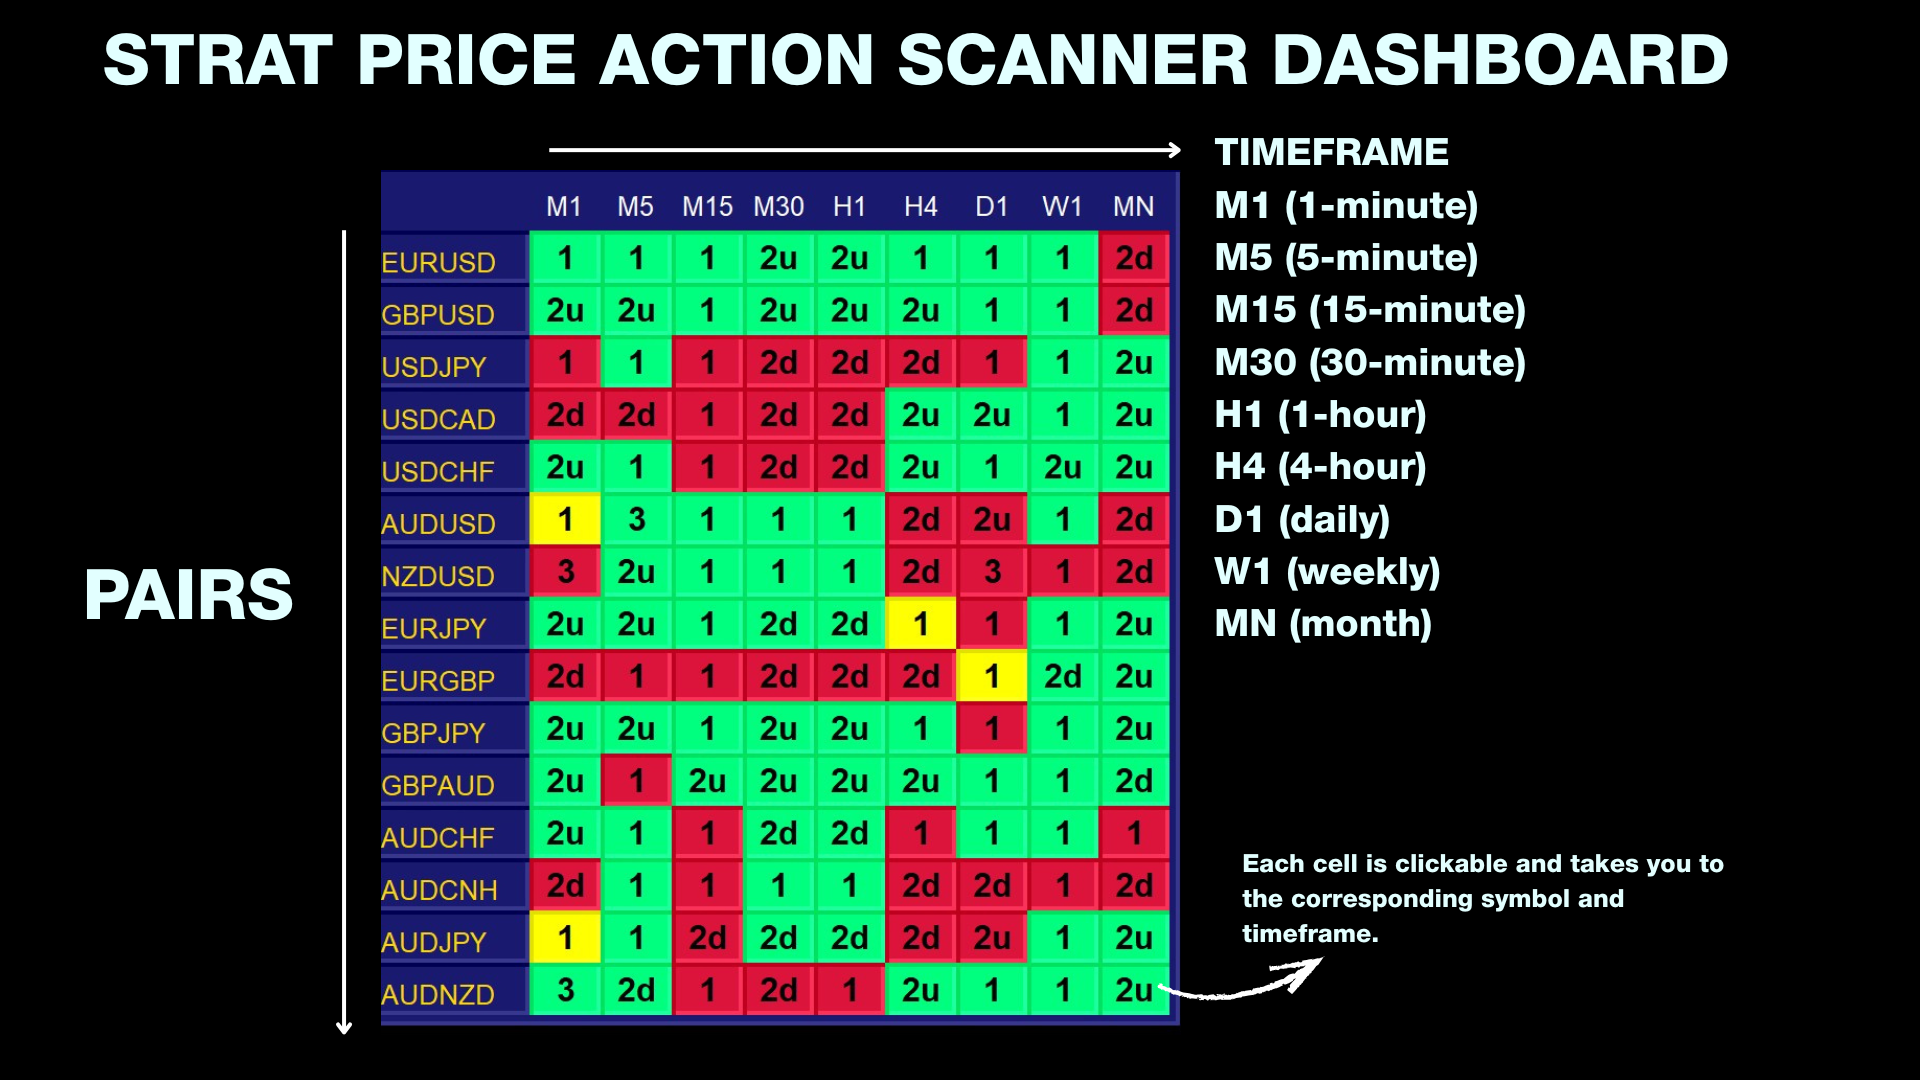
The STRAT Price Action Scanner indicator automatically labels these bar types and combos for you, so you don’t have to manually decode 1/2/3 on every candle.
Timeframe Continuity: Tides, Waves, and Ripples
In The STRAT, timeframe continuity is just a fancy way of saying:
“Are all my chosen timeframes moving in the same direction or not?”
On each timeframe (Monthly, Weekly, Daily, etc.), The STRAT only cares about one simple thing: Is price currently above the open of that candle (bullish) or below it (bearish)?
To make sense of this, it helps to think of the market like the ocean:
-
Tides – Monthly, Weekly
These are the big, slow movements. They show the overall direction the market is drifting. -
Waves – Daily
These move faster, but they still follow the tide most of the time. -
Ripples – Intraday (H4, H1, M15, etc.)
These are the small, noisy moves inside the bigger waves.
If the tides, waves, and ripples are all moving in the same direction (all bullish or all bearish), you have full timeframe continuity. You’re literally trading with the ocean, not trying to swim against it.
-
If Monthly, Weekly, and Daily are all green and pushing higher, you’re going with the flow when you look for long (buy) STRAT setups.
-
If they’re all red and pushing lower, you focus on short (sell) setups.
This is why timeframe continuity matters: it keeps you from buying into a strong higher-timeframe downtrend or shorting into a strong uptrend. You stop fighting the bigger players and start aligning with them.
Intraday Example: Choosing Your Battles (EURUSD vs USDCAD vs USDCHF)
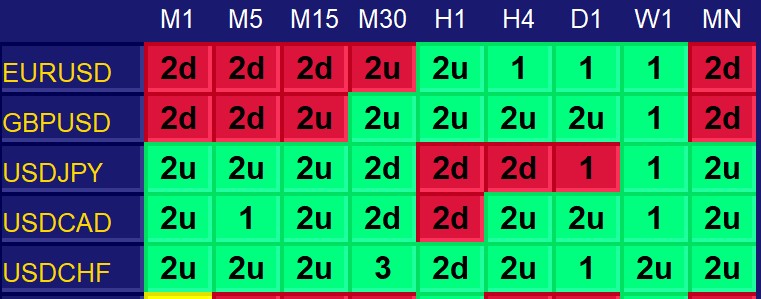
Imagine you’re an intraday trader using M15 or M30 as your main timeframe and H1/H4/D1 for direction. Your dashboard looks like this:
-
EURUSD row
-
M1–M30: mostly red (2d and 2u on red background)
-
H1: green 2u
-
H4, D1, W1: all green (1’s)
-
MN: red 2d
-
What does that say?
-
Higher intraday and swing timeframes (H4, D1, W1) are bullish – the bigger picture is up.
-
Very short-term intraday (M1–M30) is bearish – price is currently pulling back.
-
Monthly is still red, so on the very big picture EURUSD might be in a larger corrective phase.
As an intraday trader, this is messy continuity:
-
You could plan a long, treating the red lower timeframes as a pullback, but you’ll probably want:
-
A clear bullish STRAT pattern on M15/M30 or H1 (e.g. 2-1-2 up)
-
Evidence that the pullback is ending and those ripples are starting to realign with H4/D1/W1
-
-
It’s not the cleanest “all green” candidate on your list, so many traders would mark EURUSD as “wait and see” rather than their first choice.
Now compare that with USDCAD:
-
USDCAD row
-
M1–M30: mostly green (2u and 1)
-
H1: red 2d
-
H4, D1, W1, MN: all green (2u or 1)
-
Here:
-
Almost everything from M1 up to MN is bullish.
-
The only holdout is H1 showing a red 2d – likely just a small intraday dip.
For an intraday trader, this is a much cleaner bullish environment:
-
You have strong continuity on the big stuff (D1, W1, MN all green).
-
Most intraday timeframes are green as well.
-
H1 being red might simply mean you’re in the middle of a pullback, and you can watch H1/M15 for:
-
A STRAT reversal back up (e.g. 2-1-2 up, 3-1-2 up, or 2-2 reversal).
-
This is the kind of situation where you might say:
“USDCAD is broadly bullish. I’ll look for a bullish STRAT setup on M15/M30 that lines up with H4/D1 and use the end of this H1 pullback as my entry opportunity.”
Finally, USDCHF:
-
USDCHF row
-
M1–M30: all green (2u, 2u, 2u, 3)
-
H1: green 2d (a “failed” 2d to the downside)
-
H4, D1, W1, MN: all green (2u or 1)
-
This is still one of the cleanest bullish symbols on the board:
-
Strong uptrend from intraday all the way out to Monthly.
-
That green 2d on H1 means:
-
Price has taken out the previous candle’s low (2d),
-
But it’s now trading back above its own open (hence the green background).
-
In STRAT terms, that often looks like sellers tried to push it down, failed, and buyers stepped back in.
-
For an intraday trader, USDCHF is a great example of using continuity and candle behaviour together:
-
The higher timeframes (H4, D1, W1, MN) are clearly bullish.
-
The lower timeframes (M1–M30) are also bullish.
-
H1 shows a failed push down (green 2d), which can be the start of a reversal back in the main direction.
Your plan might be:
-
Watch H1 and M15/M30 for a clean bullish STRAT pattern after that green 2d (e.g. a 2-1-2 up or 3-1-2 up).
-
Enter long in line with the dominant uptrend once that pattern triggers.
-
Use our trade assistant to set entry, SL below the pattern low, and your preferred R:R.
USDCHF, in this scenario, is exactly the type of pair many intraday STRAT traders will prioritise: strong bullish continuity across the board, plus a failed attempt to go down that can fuel the next leg higher.
A Simple Workflow
Here’s a practical way to combine the method with the tool.
1. Start with Timeframe Continuity
Decide what type of trader you are for this session:
-
Swing – Use Monthly / Weekly / Daily as your main stack.
-
Intraday – Use Daily / H4 / H1 (or H1 / M15 / M5).
Then, on the dashboard:
-
Look for symbols where all those timeframes are aligned up or down.
-
Mark them mentally as your “focus list” for the session.
No continuity? No stress. Move on. You don’t have to trade everything.
2. Scan for Actionable STRAT Combos
Once you’ve got continuity filtered:
-
Use the STRAT labels on the chart to find:
-
2-1-2 reversals back into the direction of continuity
-
2-2 continuation patterns when trend is already clean
-
3. Frame the Trade With the Trade Assistant
When you see a setup you like:
-
Open the trade assistant panel from the indicator.
-
Define:
-
Your planned entry (e.g., just above the inside bar high for a long).
-
Your stop loss (often on the other side of the pattern or formation).
-
Your desired risk-to-reward (e.g. 2R, 3R).
-
-
Let the panel calculate:
-
The position size based on your risk %.
-
The exact price levels for SL and TP.
-


