A Robust Trend-Following Strategy: 13 Years of Consistent Performance

Test our product here
Strategy Edge
Our trading system is fully automated and built on an intuitive yet robust strategy. It does not rely on any complex AI or machine learning models—which typically overfit in the financial market and increase execution latency, we use a breakout, trend-following approach that leverages fundamental market dynamics with the guiding principle:
“Not every breakout results in a sustained trend, every significant trend starts with a breakout.”
Moreover, we combine this approach with disciplined risk management and effective profit-taking mechanisms, ensuring a consistently favorable reward-to-risk ratio. Over the past 13 years, we’ve rigorously backtested the strategy across 12 different instruments in multiple markets, including equities, commodities, energy, crypto, and forex. Throughout this period, our combined portfolio has demonstrated strong and consistent performance across various market conditions.
Our strategy’s simplicity helps avoid the risks of overfitting, making it more adaptable to changing market conditions. It’s the balance between capturing trends and managing risk that gives us a sustainable edge.
Backtest Result
Following is our backtest result from 2012–2024(data cutoff in September).
Balance Growth
Given an initial balance of $10,000, the total cumulative return over the period is 2479.083%. Our strategy performs extremely well during drastic market changes, specifically in 2020 when the pandemic took place.

Annualized Return

Benchmarking against the S&P500, our strategy never has a losing year. Here are the specific breakdowns.
Overall Metrics

| Mean Return | 29.3% |
| Standard Deviation | 17.1% |
| Sharpe Ratio | 1.71 |
| Maximum Drawdown | -23.4% |
| Win Rate | 37.37% |
| Profit Factor | 2.02 |
| Correlation with S&P500 | -0.3 |
Our strategy delivers an average return of 29.3%(post-cost), with a standard deviation of only 17.1%. As a trend-following approach, it typically experiences small losses during periods of consolidation but captures significant gains when trends emerge. This results in a win rate of approximately 37%, complemented by a robust profit factor of 2.02.
Additionally, the strategy exhibits a negative correlation of -0.3 with the S&P 500, suggesting it serves as a valuable diversifier within an asset allocation portfolio.
Robustness of Backtest
Avoid overfitting risk
The strategy is idea-driven, rather than data-driven, and is adapted from a former trading strategy. It doesn’t rely on extensive parameter tuning to be profitable across multiple markets. In essence, there is no “fitting” process involved. Instead, the strategy combines a straightforward, intuitive idea with disciplined risk management to achieve its performance.
For more about how we avoid overfitting, check How to Identify a Profitable Strategy.
Parameter sensitivity
Secondly, we surely want to avoid strategies that are highly sensitive to parameter changes — where a small tweak can lead to significant performance deviations, as this is a clear sign of overfitting. In contrast, our strategy is intuitive, with only less than five key parameters.
This minimal and well-structured parameter set helps ensure the strategy is robust, rather than reliant on fine-tuning. For example, the following is our strategy performance on one of our instruments with different parameters.
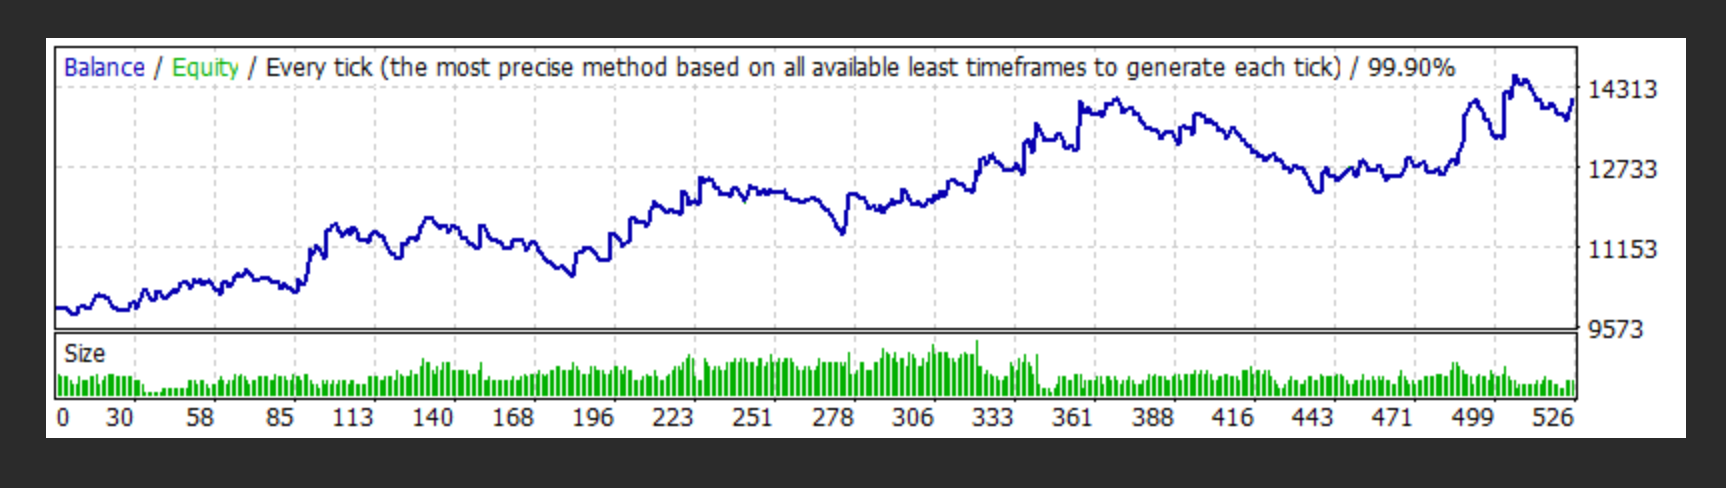
breakout parameter = 10
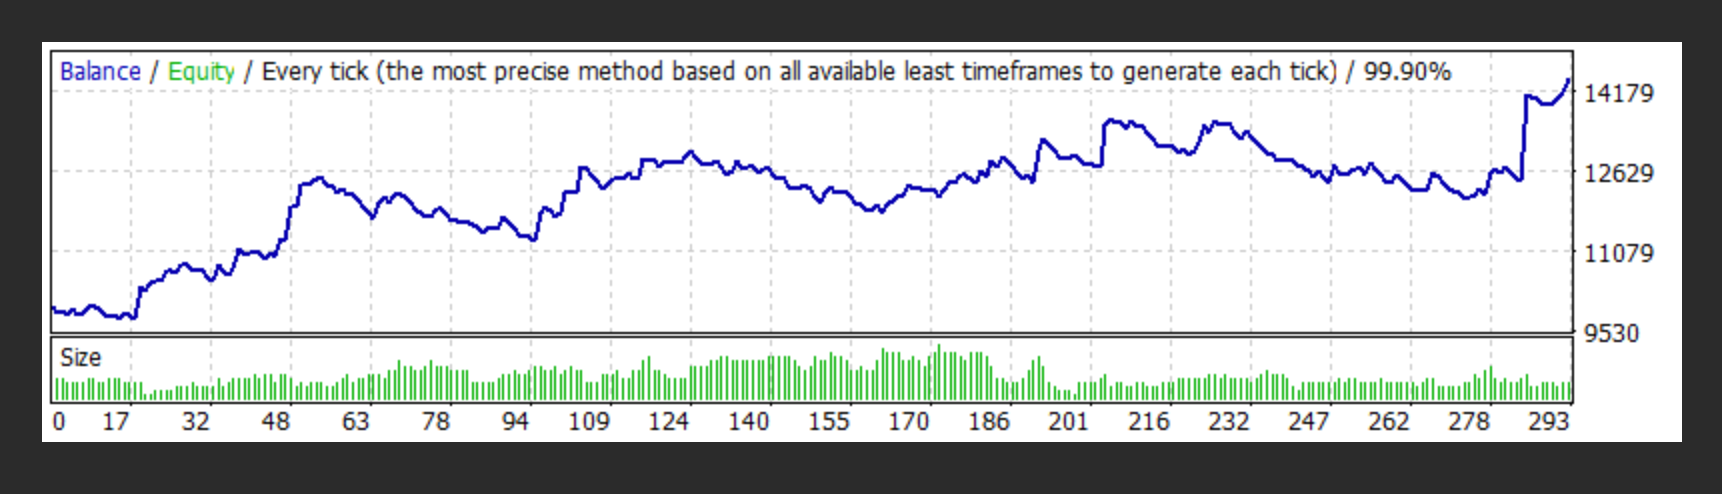
breakout parameter = 20
As you can see, by changing this key parameter from 10 to 20 — a substantial adjustment for this particular parameter — the performance remains relatively stable, without significant deviation. This demonstrates the robustness of our strategy.
Fees simulations
Last but not least, for any actively traded strategy, fees are a crucial factor in determining true profitability. Many strategies may show strong returns in backtesting without accounting for fees, only to perform poorly in real-world trading. We fully recognize the importance of incorporating fees in our backtesting to ensure realistic results. Below are the fees we have considered in our analysis:
- Commission: The charge on open and close a trade. It is proportional to the position size.
- Swap: The cost of holding a position overnight. While this cost can sometimes be positive, for most trend-following strategies, this cost can contribute significantly to profitability.
- Execution cost: In other words, slippage cost. For market orders, when you place a trade at $71, you might end up buying/selling the position at $71.1 or $70.9, which means some profit can be taken by the slippage.
- Spread cost: Some brokers have implicit charges on the spread.
Risk Management
Our risk management comprises two parts.
- Small Risk Percentage per Trade: For each trade, we risk only a small percentage of the underlying account. Additionally, we place stop-losses that are dynamically adjusted based on market volatility, ensuring risk is well-contained in every position.
- Diversification: We diversify our trades across different markets while limiting the risk exposure to highly correlated markets. This approach helps spread risk and ensures that any drawdowns remain moderate.
Following are screenshots of our recent living trading transactions.
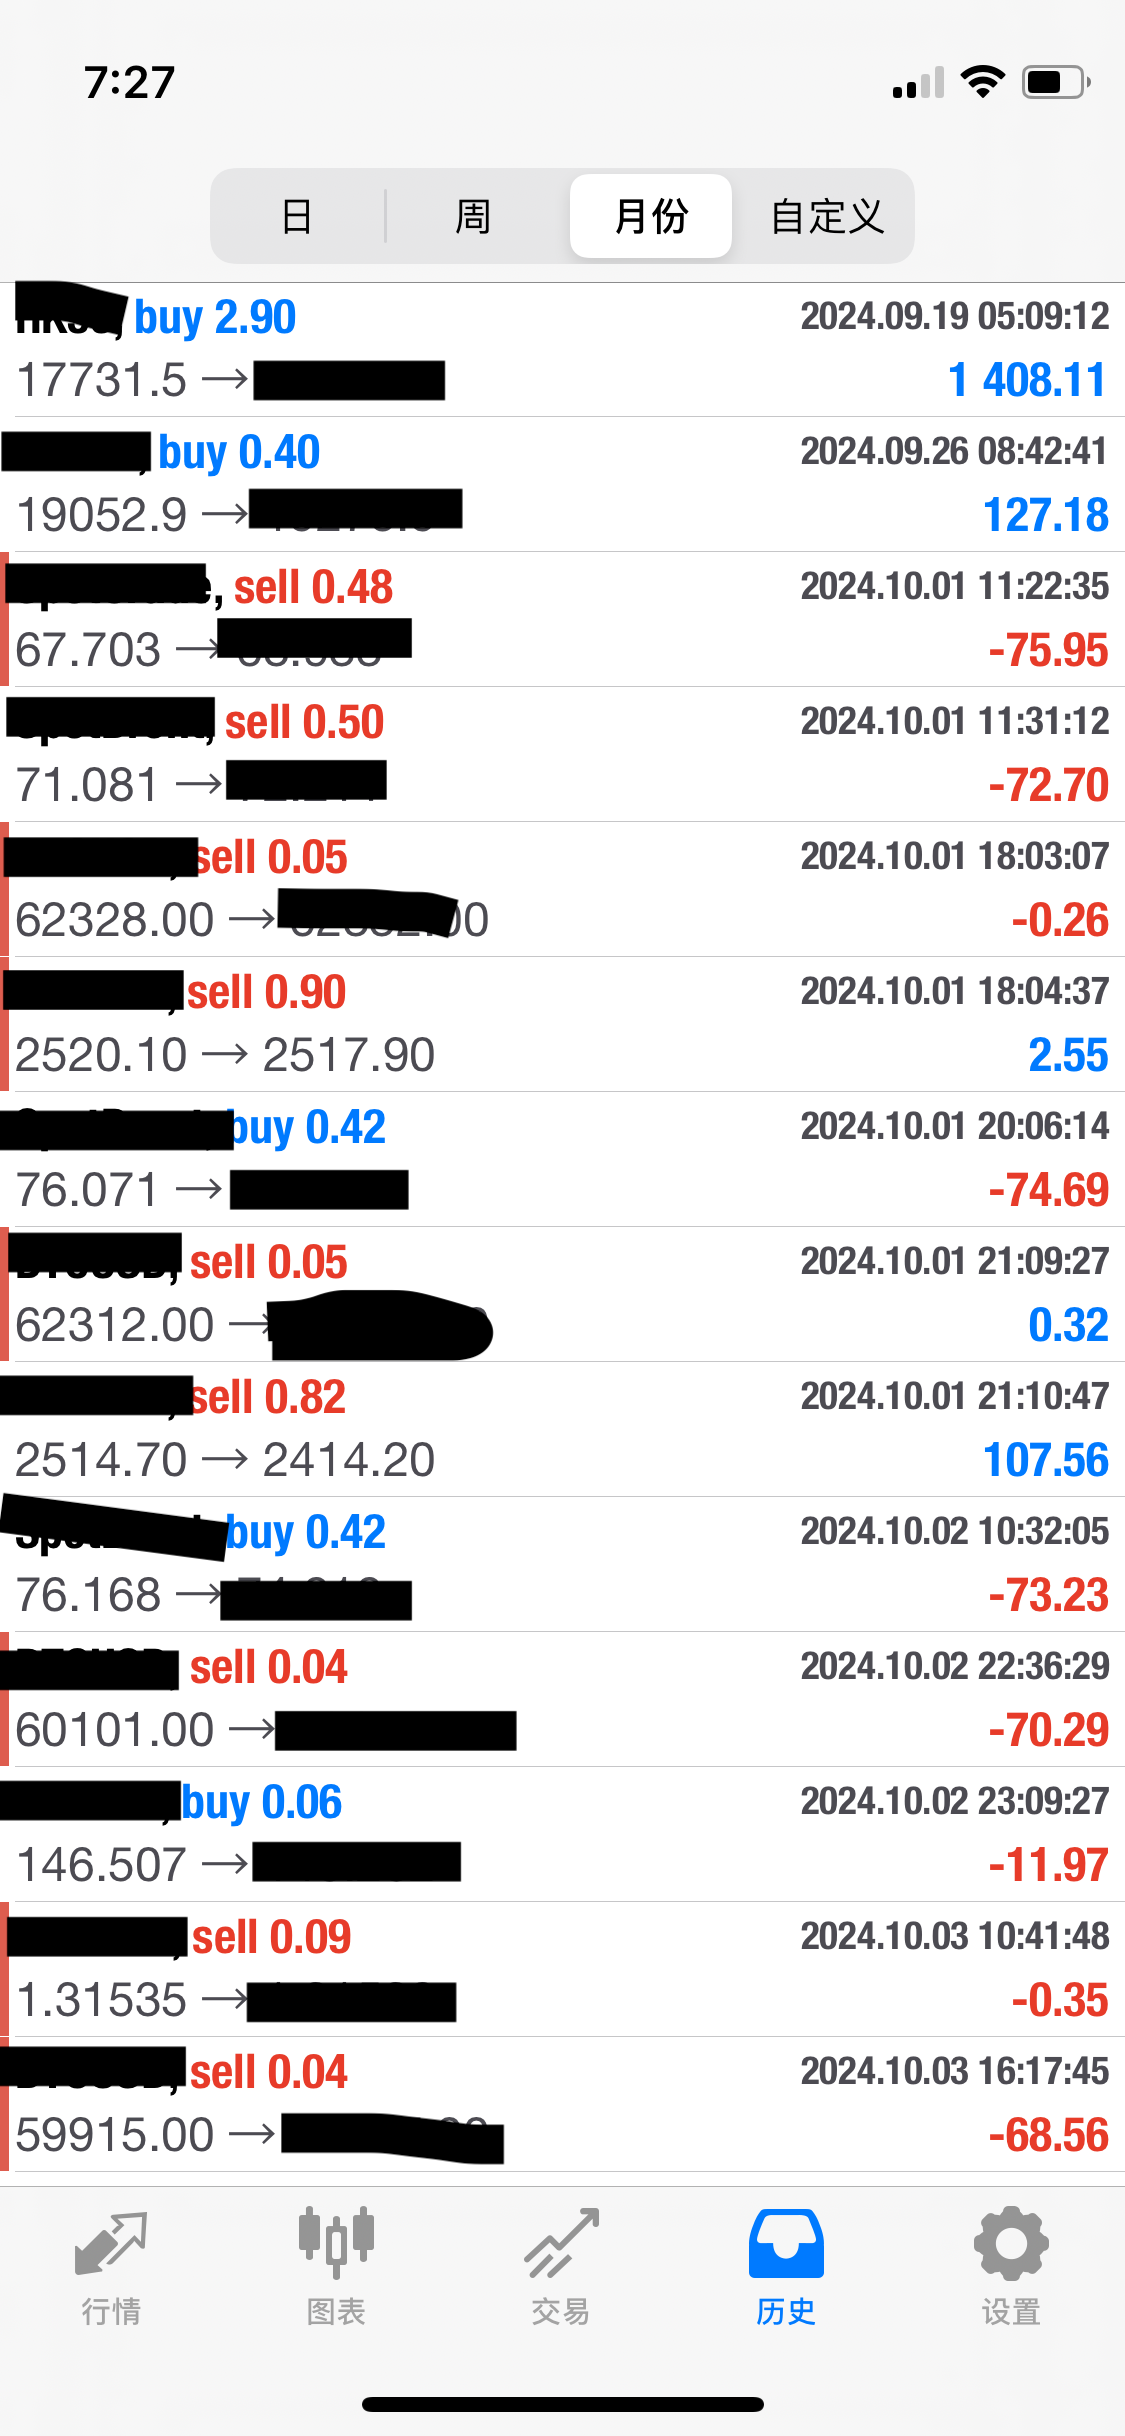 | 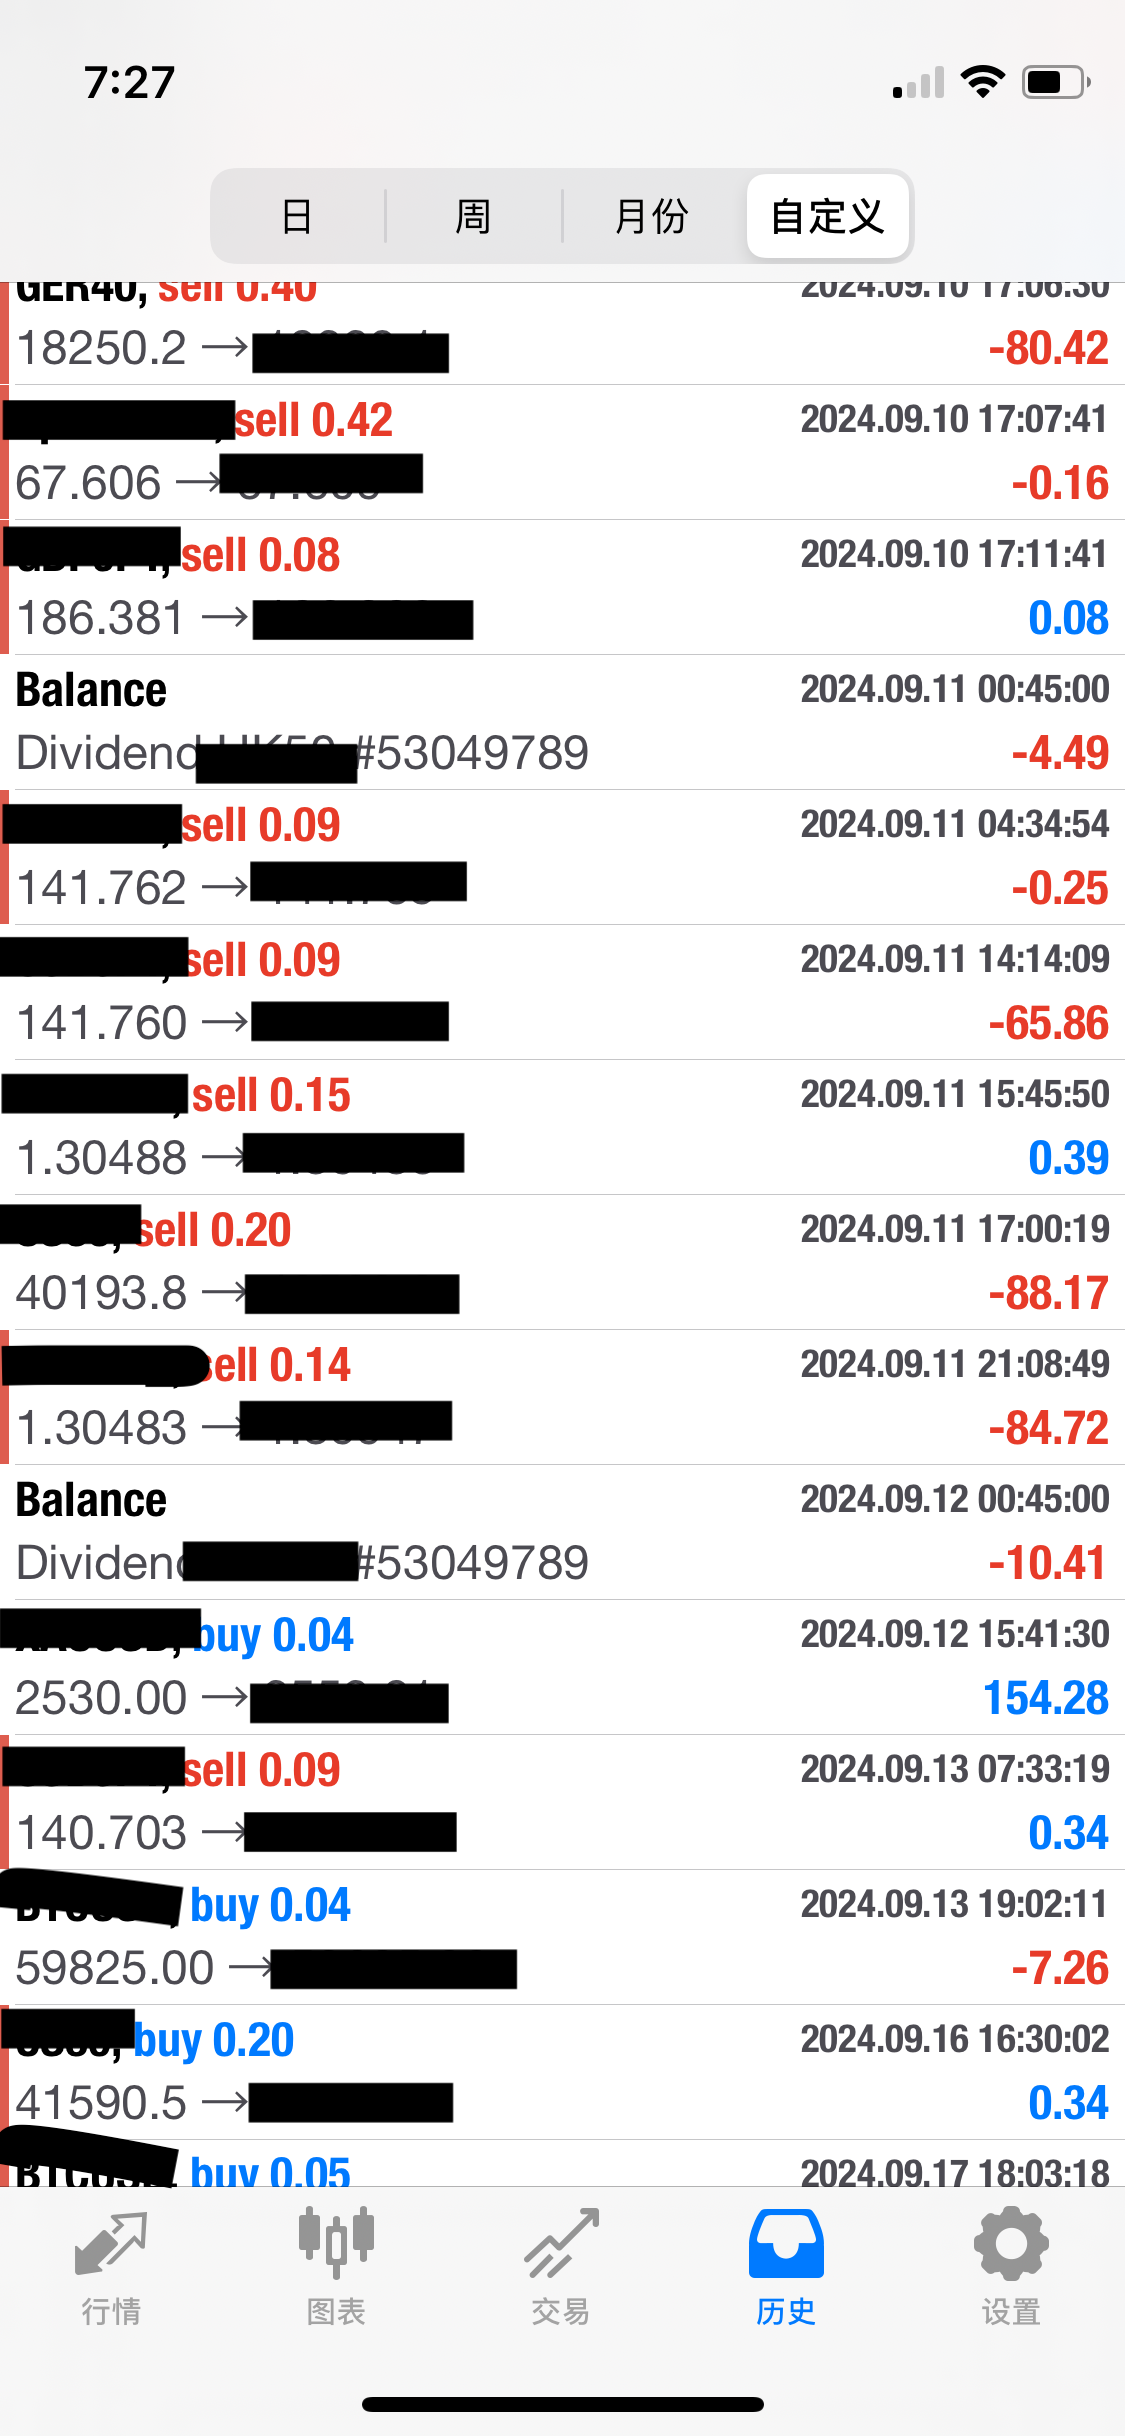 |
From the trading screenshot above, you can observe the strength of our risk management strategy. It primarily incurs small losses and modest gains but occasionally captures significant wins that account for the majority of the year’s profit. This highlights the effectiveness of our approach in managing risk while capitalizing on major market opportunities.
Live Trading Performance
Of course, any trading strategy requires real-world validation. Below is the profitability over a 1-year period from July 2023 to July 2024. As shown, the initial deposit was $10,000, and the profit exceeded $7,000, resulting in a gain of more than 70% over the past year. (This account uses a slightly higher risk)
Execution Infrastructure
Our trades are fully automated and executed on MetaTrader using Expert Advisor. We have taken extensive measures to guarantee that our system operates seamlessly, ensuring that trades are executed precisely as intended.
Proactive Monitoring and Alerts
Our system monitors key metrics (broker connectivity, time drift, margin levels) and sends real-time alerts for fast intervention, protecting any trading performance degradation.
Error Handling and Recovery
Our EA design is integrated with a comprehensive error-handling mechanism. All incidents are logged for further analysis, allowing us to continually improve the system. In cases of critical errors from the broker, a cooldown mechanism activates, preventing unwanted trades and ensuring that operations resume safely.
Seamless Operation
Our EA is designed for user convenience and flexibility. It handles reloading or setting changes smoothly, even with open trades.
Proven Stability
Last but not least, our EA has a strong track record in real-world trading, demonstrating reliability and consistent performance.
By investing in our EA, you are choosing a solution that not only meets but exceeds industry standards for reliability and performance. We are committed to providing the tools you need for successful trading, backed by a robust support system.
About Us
We are @lookatus, a dedicated team of traders and engineers committed to creating REAL profitable, systematic trading solutions. With a strong foundation in quantitative analysis and cutting-edge technology, our mission is to deliver reliable, data-driven trading systems that capitalize on market opportunities with precision and consistency. Beyond building advanced tools, we are passionate about empowering traders through practical education, equipping them with real, actionable insights to navigate markets intelligently and successfully.
Contact us at: haylookatus@gmail.com


")

![[XAUUSD]: Weekly Liquidity Activation Points (timings), June 22-26, 2026](https://c.mql5.com/6/1013/splash-preview-771790.png "[XAUUSD]: Weekly Liquidity Activation Points (timings), June 22-26, 2026")