
The Multi Strategy Balance Analyzer has been meticulously designed to empower algorithmic traders. It provides a platform to visualize and test trading strategies, allowing them to closely monitor, during the optimization process, the performance of individual strategies—be it by magic numbers or symbols. This is instrumental in gaining insights into the precise dynamics of each strategy and understanding how they can influence the overall behavior of the software. Furthermore, by utilizing an advanced correlation table, traders can optimize the diversification of individual strategies with unprecedented speed on the Metatrader platform.
The following tool can be purchased on the MQL store at the link provided:
Main Features
Graphical Objects:
-
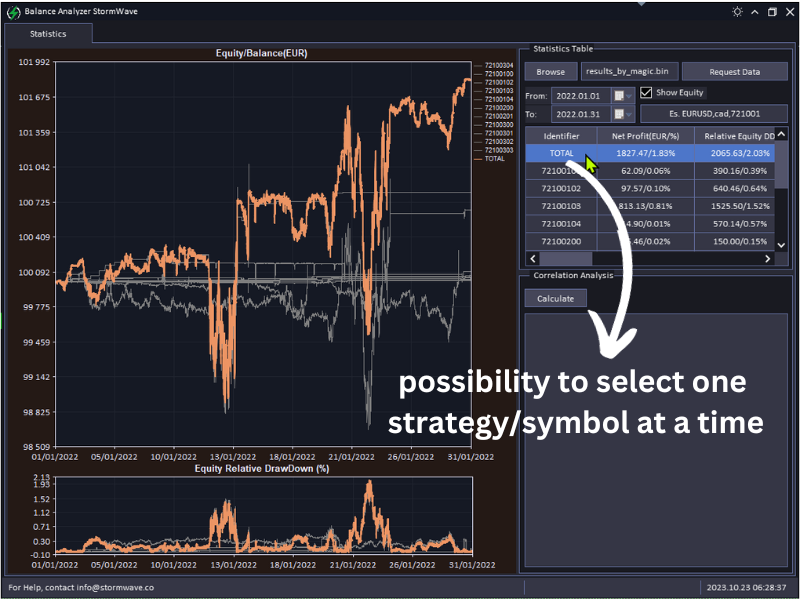
Balance/Equity Chart: This chart depicts the progression of strategies, differentiated by magic numbers or symbols. Each strategy is assigned a distinct color for easy identification. By selecting a specific strategy, users can closely observe its precise evolution. The Y-axis showcases the monetary value of the Balance or Equity, while the X-axis represents the temporal progression, capturing the historical dynamics of the strategies. This chart is crucial during optimization as it pinpoints both the highs and lows, thus revealing the true nature of each strategy.
-
Equity DrawDown Chart (%): This chart facilitates the examination of the DrawDown for every strategy and is closely aligned with the Balance/Equity chart. It offers an immediate visual representation of performance in percentage terms, enabling traders to swiftly identify underperforming strategies. This visualization is essential for optimizing a specific strategy within the strategy basket, ensuring overall system balance.
-
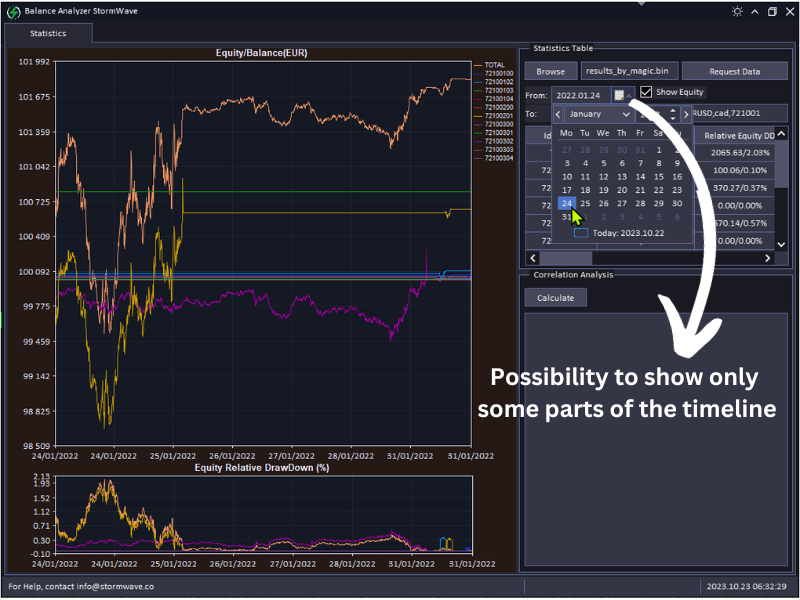
Calendar Tool: This tool provides users with the capability to select a specific time frame to examine equity/balance curves, their statistics, and degree of correlation, with day-to-day precision.
-
Filter Box: Users can input and isolate specific strategies through this feature, offering a streamlined approach to gauge the effectiveness of individual strategies.
-
Strategy Table: This table serves as a directory for traders to associate each strategy with its identifier—be it a magic number or a symbol. It encompasses a variety of statistical data. (Feedback is encouraged regarding additional statistical data to enhance future upgrades.) By selecting a strategy, users can isolate its representation on the charts, gaining a clearer perspective of its performance trajectory.
-
Correlation Table: This vital table equips traders with the ability to conduct a correlation analysis among the strategies displayed on the chart. For optimization purposes, this table pinpoints correlated strategies, guiding traders to eliminate them and thereby enhance diversification and mitigate overall risk.
Note: Correlation computations were executed by crafting a time series that encapsulated the equity and balance values of various trading strategies. This series was subsequently employed to calculate the correlation matrix amongst different strategies, illuminating the relationship between diverse trading algorithms in terms of performance and trade synchronization.
Statistics Tab
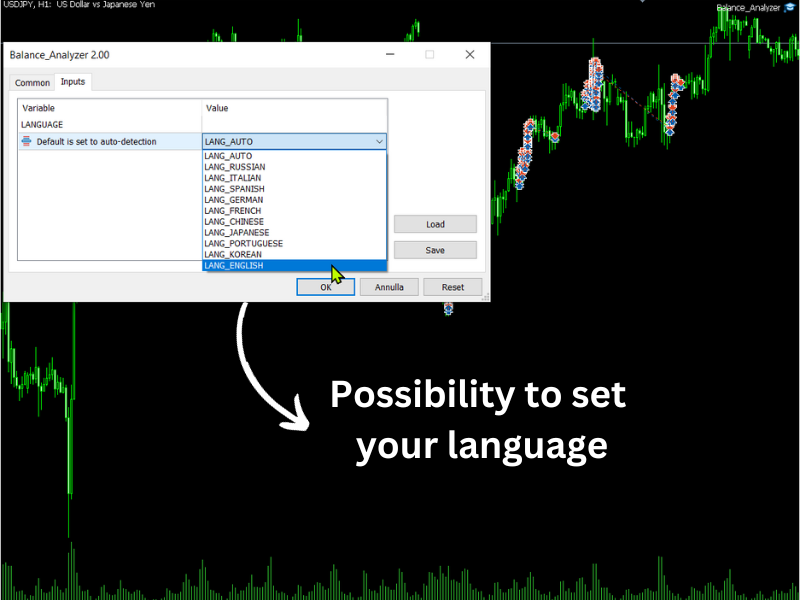
Language Selection: Users can adjust the language based on their preferences. By setting the language to LANG_AUTO, the terminal's default language will be automatically chosen.
Software Usage:
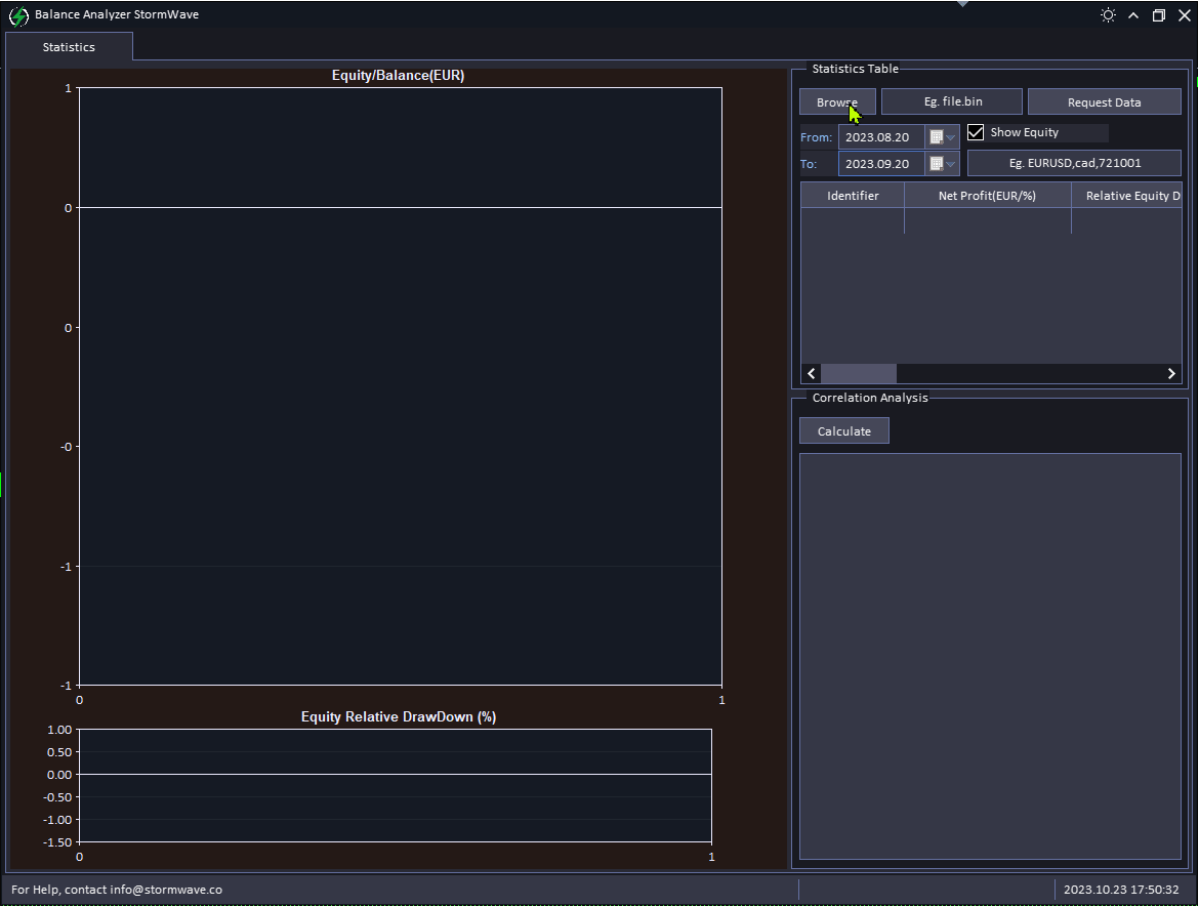
- To initiate the software, click on "Browse" (1) and select the .bin file containing the strategy data you wish to analyze (details to follow).
- Next, click on "Request Data" (2) to load and visualize the data on the platform's charts.
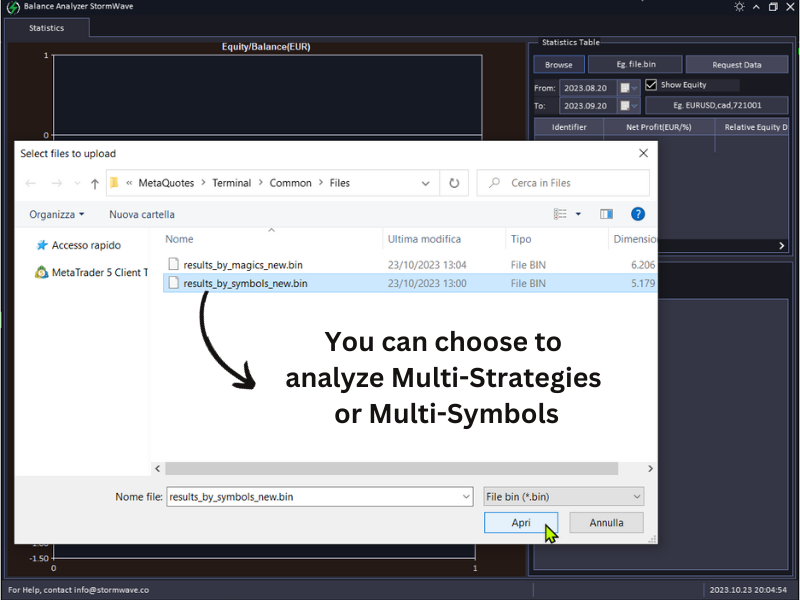
Once executed, the table will display all the strategies extracted from the .bin file, categorized either by magic numbers or by symbols.
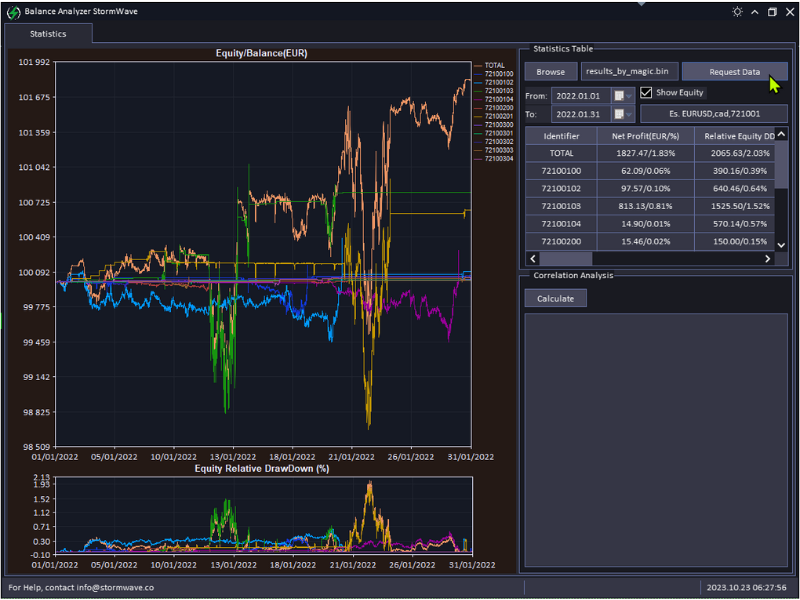
Upon uploading the data file, users can choose between viewing either the balance or the equity of the strategies by using the 'Show Equity' toggle. The statistical table will then present various metrics, enabling users to sort strategies based on these metrics.

Individual strategies can be selected for detailed analysis, effectively isolating them from others.
Using the calendar tool, a custom time range can be chosen, allowing in-depth examination and data calculation for each displayed strategy.
Clicking the "Calculate" button allows for an intricate correlation analysis among strategies, examining correlations between purpose-built time series. This aids in understanding the relationship between different trading algorithms in terms of both performance and trade synchronization.

Creating the .bin File for Platform Upload:
- Download the specified Report_StormWave.mqh file and integrate it with the main file of your expert advisor.
- Ensure you download the Report_StormWave.ex5 library and place it in the "Libraries" folder.
#property copyright "Copyright 2023, StormWave Trading Technologies"
#property link "https://stormwave.co/"

// Enumeration for specifying the calculation mode
enum CalculationMode
  {
   BY_MAGIC,    // Calculation by magic numbers
   BY_SYMBOL    // Calculation by trading symbols
  };

//+------------------------------------------------------------------+
//| Class for creating reports                                       |
//+------------------------------------------------------------------+
class CCreateReport
  {
public:
   CalculationMode   m_mode;       // Variable to store calculation mode
   int               m_reserve;    // Variable to store reserve size for data resizing

public:
   // Constructor
   CCreateReport(void){ };
   // Destructor
   ~CCreateReport(void){ };

   // Set the calculation mode for the file
   virtual void      SetMode(const CalculationMode mode)          { m_mode = mode;   };
   // Set the reserve size for data resizing
   virtual void      SetReserve(const int reserve)                { m_reserve = reserve;   };

   // Extract equity data for a strategy into an array of structures
   virtual void      StoreDataInArray(ENUM_TIMEFRAMES time = PERIOD_M5){ };

   // FILE WRITING
   // Function to create a BIN file with the data from the structure created with CreateDataArray
   virtual bool      CreateBinReport(const string fileName = "resutlts.bin"){ return true;};
  };
Here's an example of how to incorporate the library into the expert advisor:
#property copyright "Copyright 2023, StormWave"
#property link      "https://www.stormwave.co"
#property version   "1.00"

//--- Include the parent class of the virtualized library
#include "Report_StormWave.mqh"

//--- Import the library and the necessary object to create the report
#import "Report_StormWave.ex5"
CCreateReport *iCreateReport();
#import

//--- A new report object for magic numbers is created
CCreateReport *m_create_report_magic;
//--- A new report object for symbols is created
CCreateReport *m_create_report_simbols;

//+------------------------------------------------------------------+
//| Function for the initialization of the expert                     |
//+------------------------------------------------------------------+
int OnInit()
  {
//---
//--- The object is assigned in the OnInit() and it's set that data acquisition mode is by magic numbers
   m_create_report_magic = iCreateReport();
   m_create_report_magic.SetMode(BY_MAGIC);
   //m_create_report_magic.SetReserve(100000000); // with the latest version it is not necessary to set the reserve as it is calculated automatically
   //--- The reserve is used to speed up the data acquisition process during backtesting so as not to affect the backtest time

//--- The same is done for symbols
   m_create_report_simbols = iCreateReport();
   m_create_report_simbols.SetMode(BY_SYMBOL);
   //m_create_report_simbols.SetReserve(100000000);
//---
   return(INIT_SUCCEEDED);
  }
//+------------------------------------------------------------------+
//| Function for the deinitialization of the expert                  |
//+------------------------------------------------------------------+
void OnDeinit(const int reason)
  {
//---
//--- IMPORTANT: delete the object in the OnDeinit function
   delete m_create_report_magic;
   delete m_create_report_simbols;
  }
//+------------------------------------------------------------------+
//| Function for the expert tick                                     |
//+------------------------------------------------------------------+
void OnTick()
  {
//---
//--- In the OnTick() function, the following functions must be inserted to store data from the tester.
//--- If PERIOD_CURRENT is inserted, data is taken every minute if "OHLC 1 minute" is set on the tester or per tick for other configurations
//--- CAUTION: it is advisable to use PERIOD_M1 onwards, as tick data might be so much to
//--- slow down the process, despite the allocated memory reserve.
   m_create_report_magic.StoreDataInArray(PERIOD_M5);
   m_create_report_simbols.StoreDataInArray(PERIOD_M5);
  }
//+------------------------------------------------------------------+
//| Tester function                                                  |
//+------------------------------------------------------------------+
double OnTester()
  {
//---
//--- In the OnTester() function, which is executed at the end of each backtest, the report in .bin format is created
//--- and it is saved in the \MetaQuotes\Terminal\Common\Files folder
   m_create_report_magic.CreateBinReport("results_by_magic_new.bin");
   m_create_report_simbols.CreateBinReport("results_by_magic_new.bin");

   double ret=0.0;
//---

//---
   return(ret);
  }
Conclusions:
This software has been tailor-made to swiftly and securely analyze equity and balance curves. It facilitates a comprehensive study of various statistics for each strategy, allowing users to select and isolate individual strategies, sort them based on precise parameters, or filter the strategies they wish to view based on magic numbers or symbols of interest. The platform also supports a thorough correlation analysis between strategies, ensuring maximum decorrelation analysis to avoid the pitfalls of strategy correlation that could jeopardize diversified investment principles.
Acknowledgments:
Special thanks to Anatoli Kazharski for crafting the graphical interface library. It has been thoroughly reviewed and optimized to enhance its efficiency and efficacy.


")
")