
ETHUSD: Double Bottom Pattern Above $1580
Ethereum was unable to sustain its bearish momentum and after touching a low of 1584 on 04th Aug started to correct upwards against the US dollar crossing the $1800 handle in the European trading session today.
We can see a continuous uptick in the prices of Ethereum due to the heavy buying pressure seen since yesterday.
We can clearly see a double-bottom pattern above the $1580 handle which is a bullish pattern and signifies the end of a bearish phase and the start of a bullish phase in the markets.
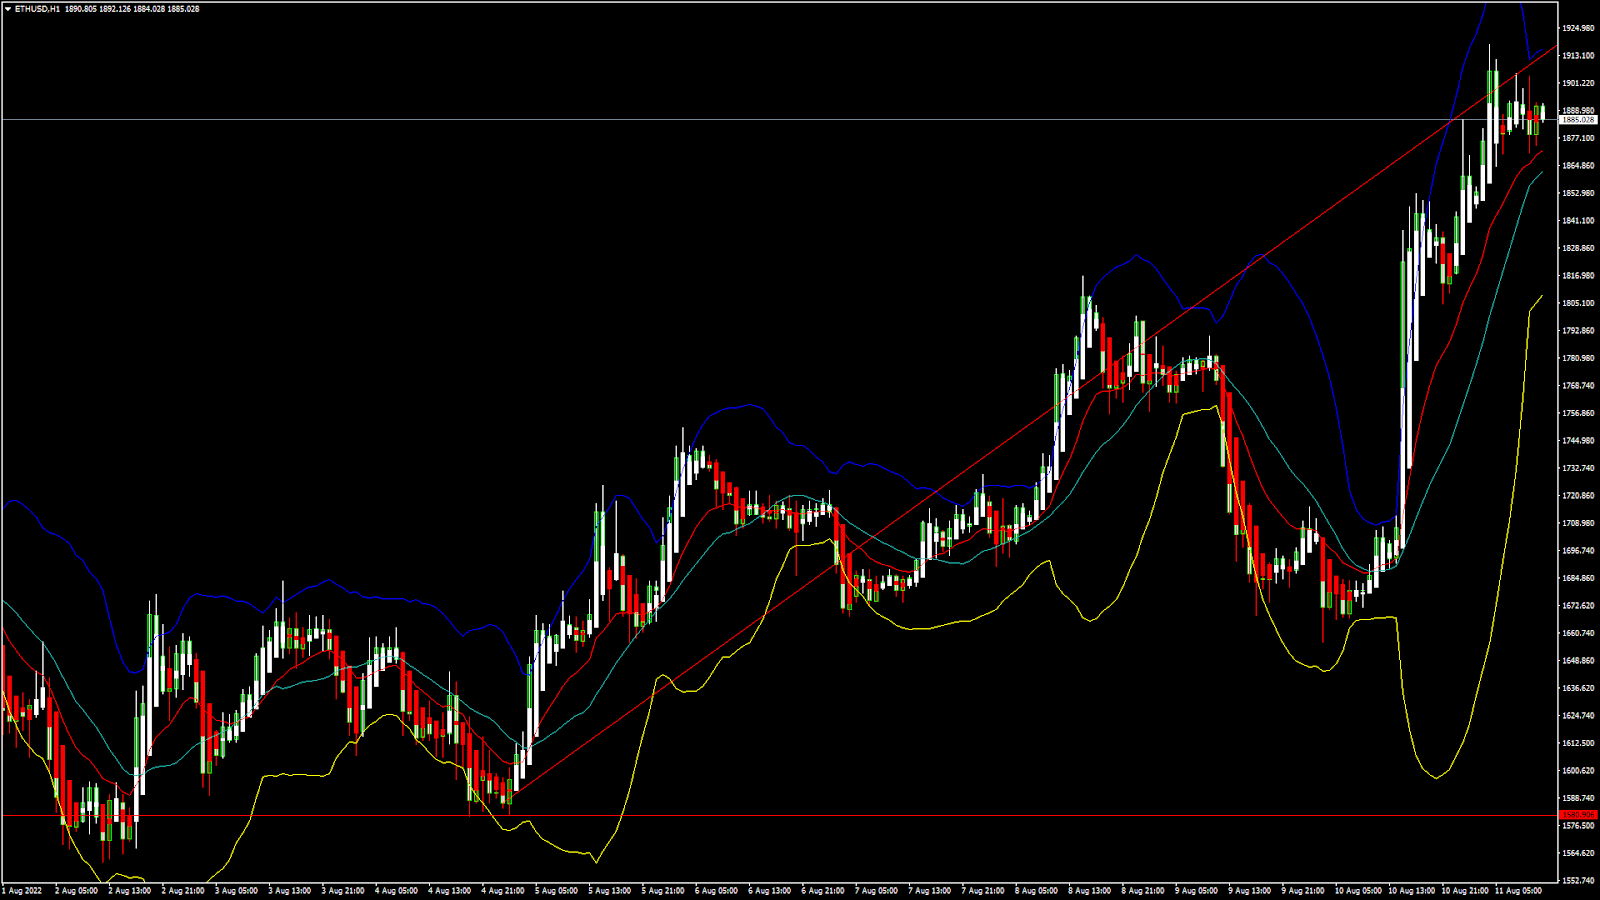
ETH is now trading just above its pivot level of 1884 and moving into a strong bullish channel. The price of ETHUSD is now testing its classic resistance level of 1895 and Fibonacci resistance level of 1901 after which the path towards 2000 will get cleared.
The relative strength index is at 67 indicating a strong market and the continuation of the uptrend in the markets.
We can see the formation of a bullish harami pattern on the 2-hour time-frame indicating the underlying bullish nature of the markets.
The STOCHRSI is indicating an oversold market, which means that the prices are due for an upwards correction.
All of the technical indicators are giving a strong buy market signal.
All of the moving averages are giving a strong buy signal and we are now looking at the levels of $1900 to $2000 in the short-term range...More info: blog FXOpen


")