
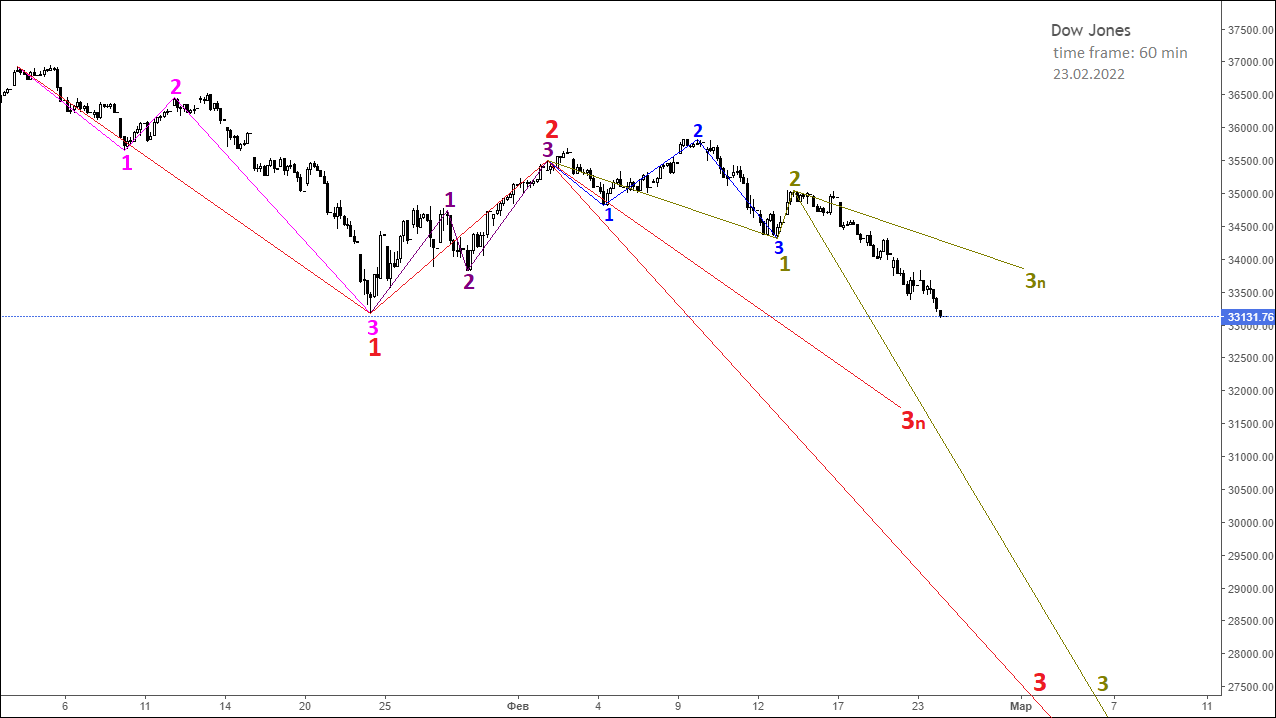
Dow Jones, fractal structure (timeframe 1 hour / 02/23/2022).
Dow Jones, fractal structure (time frame 1 hour / 02/23/2022).
As of February 23, 2022, we can say that in the fractal structure of the Dow Jones index chart, the formation of the 3rd segment of the fractal, marked in red, is underway.
The fractal marked in olive color is the 3rd segment of the red fractal, which has a higher order by one.
The 1st segment of the olive fractal is marked with a blue fractal. Completion of the 1st and 2nd segments of the olive fractal indicates that the current downward dynamics of the index will continue as part of the formation of the 3rd segment.
In this case, most likely, the decrease in the index values will take place to the level of 27,000 points.
Such a model of the future dynamics of the Dow Jones index was formed by the following local fractal structures.
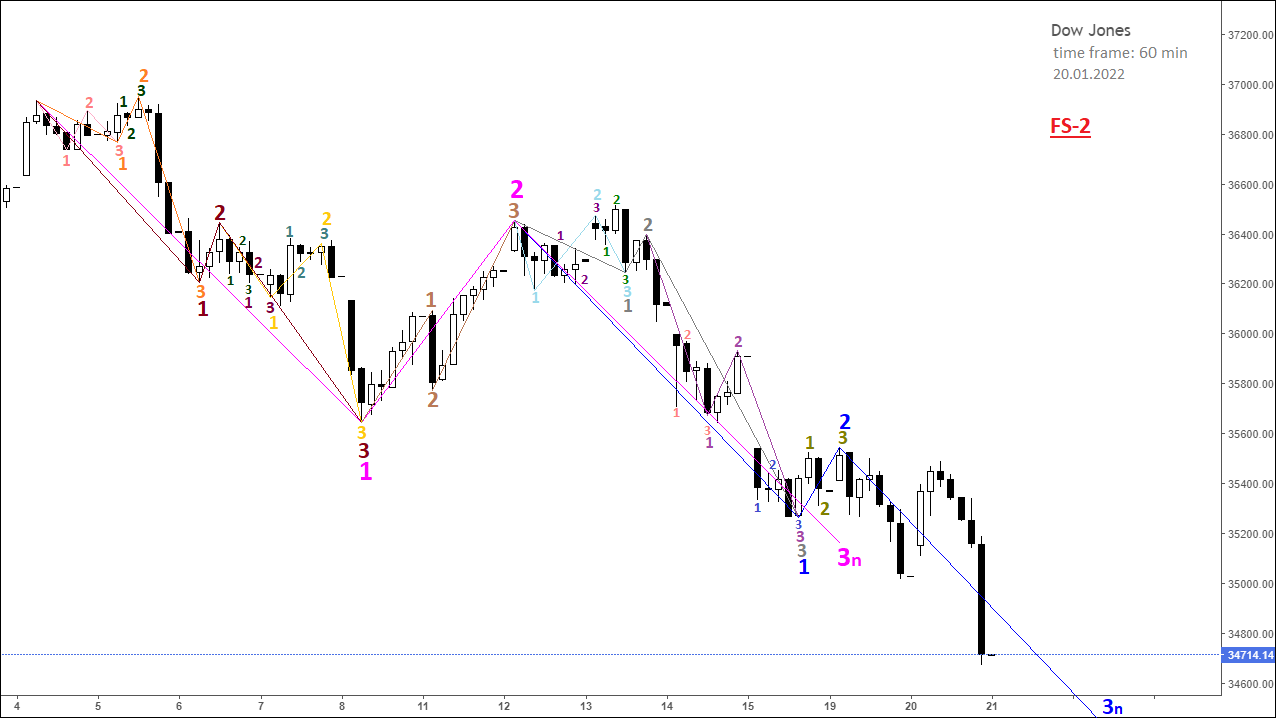
Dow Jones, fractal structure (time frame 1 hour / 01/20/2022).
An alternative model for the development of the fractal structure of the Dow Jones index, built with a time frame of 1 hour, suggests that the 3rd segment of the fractal, which is indicated in pink, has not yet been completed and that only the 1st and 2nd segments can be said to be completed blue fractal, which are part of the 3rd segment of this pink fractal.
In this case, the future dynamics of the index will be negative as part of the completion of the 3rd segment of the blue fractal, which will complete the 3rd segment of the pink fractal.
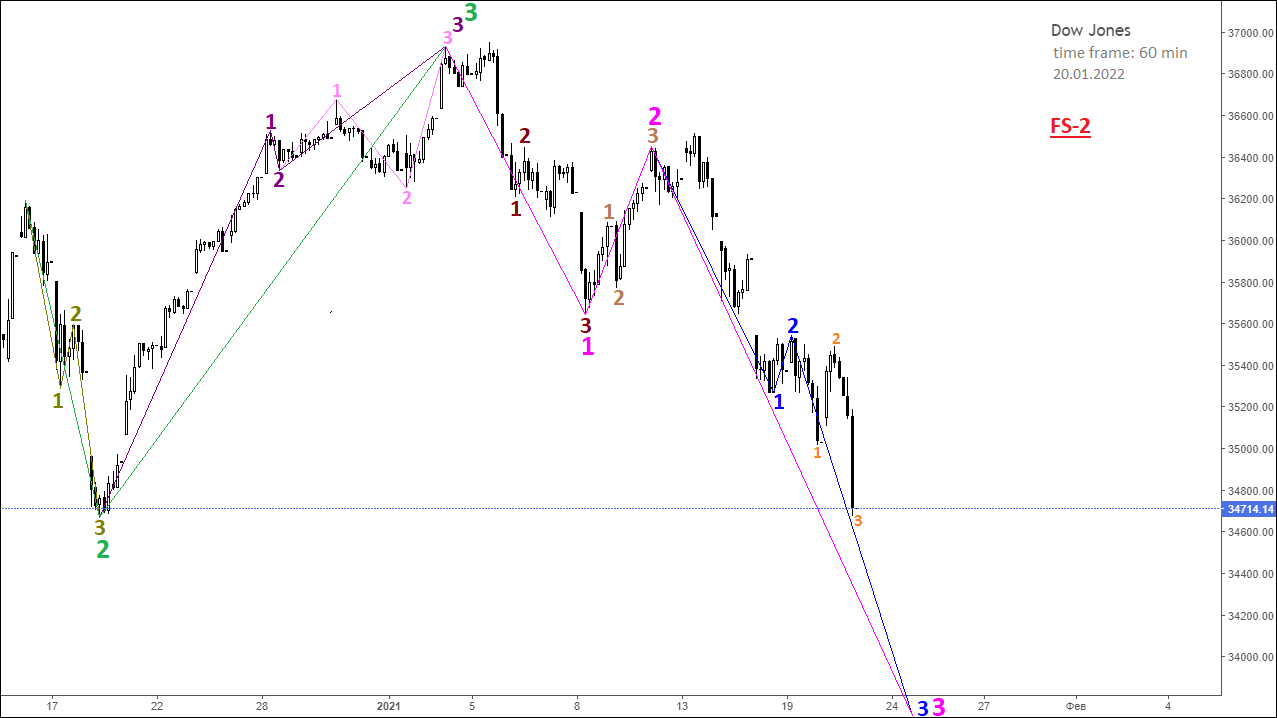
Dow Jones, fractal structure (time frame 1 hour / 01/20/2022)_continued.
According to the alternative model FS-2 of the development of the fractal structure of the Dow Jones index chart, built with a time frame of 1 hour as of 01/20/2022, the 3rd segment of the fractal is formed, which is indicated in pink.
As part of the formation of this 3rd segment of the pink fractal, the upcoming dynamics will be downward as part of the completion of the 3rd segment of the blue fractal, which has an order of 1 unit lower than the order of the 3rd segment of the pink fractal.
In this case, we can say that the fractal indicated by the orange numbering is the 1st segment inside the 3rd segment of the blue fractal.
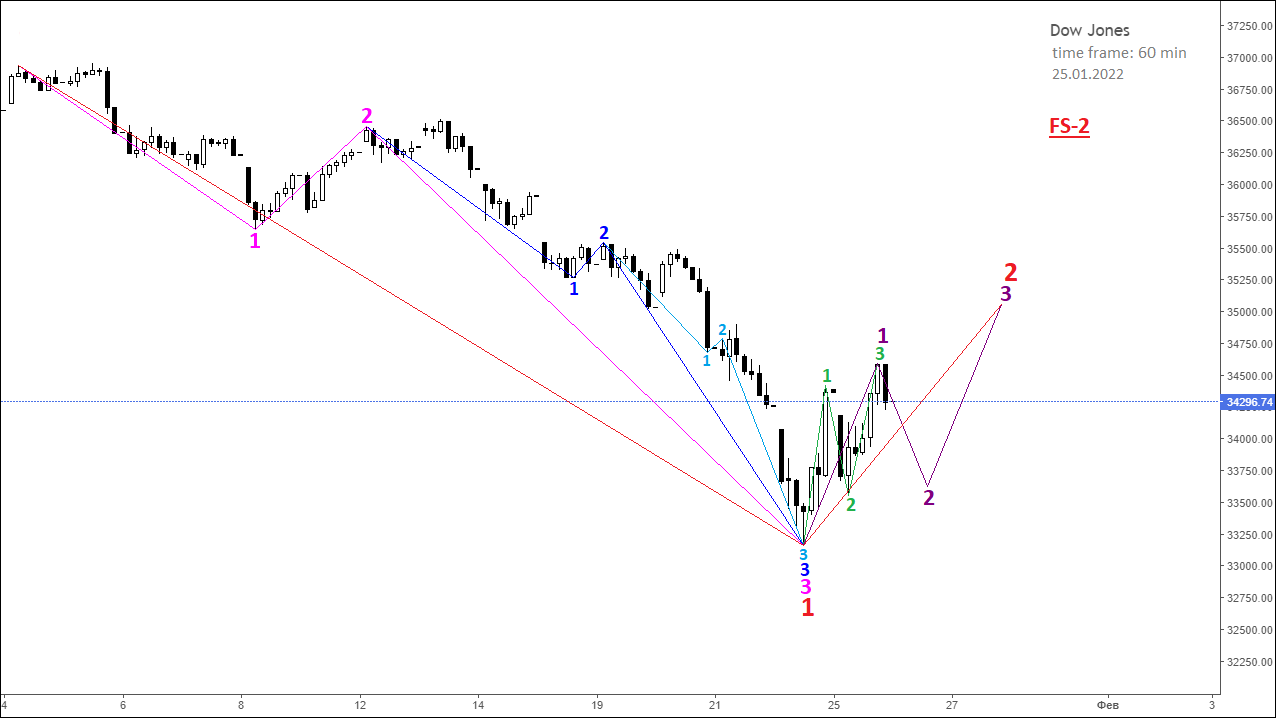
Dow Jones, fractal structure (time frame 1 hour / 01/25/2022).
As of 01/25/2022, according to the alternative model of the development of the FS-2 fractal structure, we can say that the fractal marked in pink is completed and represents the 1st segment of the fractal of a higher order, marked in red.
The completion of the pink fractal occurred with the simultaneous completion of the blue fractal, which is the 3rd segment of the pink fractal, and the blue fractal, which is the 3rd segment of the blue fractal.
In this case, it can be assumed that in the fractal structure of the chart, the formation of the 2nd segment of the red fractal, indicated by the purple fractal, is underway.
The 1st segment of the purple fractal is the green fractal. With this in mind, we can say that the upcoming dynamics of the index will be upward as part of the formation of the 2nd and 3rd segments of the purple fractal.
Dow Jones, fractal structure (time frame 1 hour / 01/31/2022).
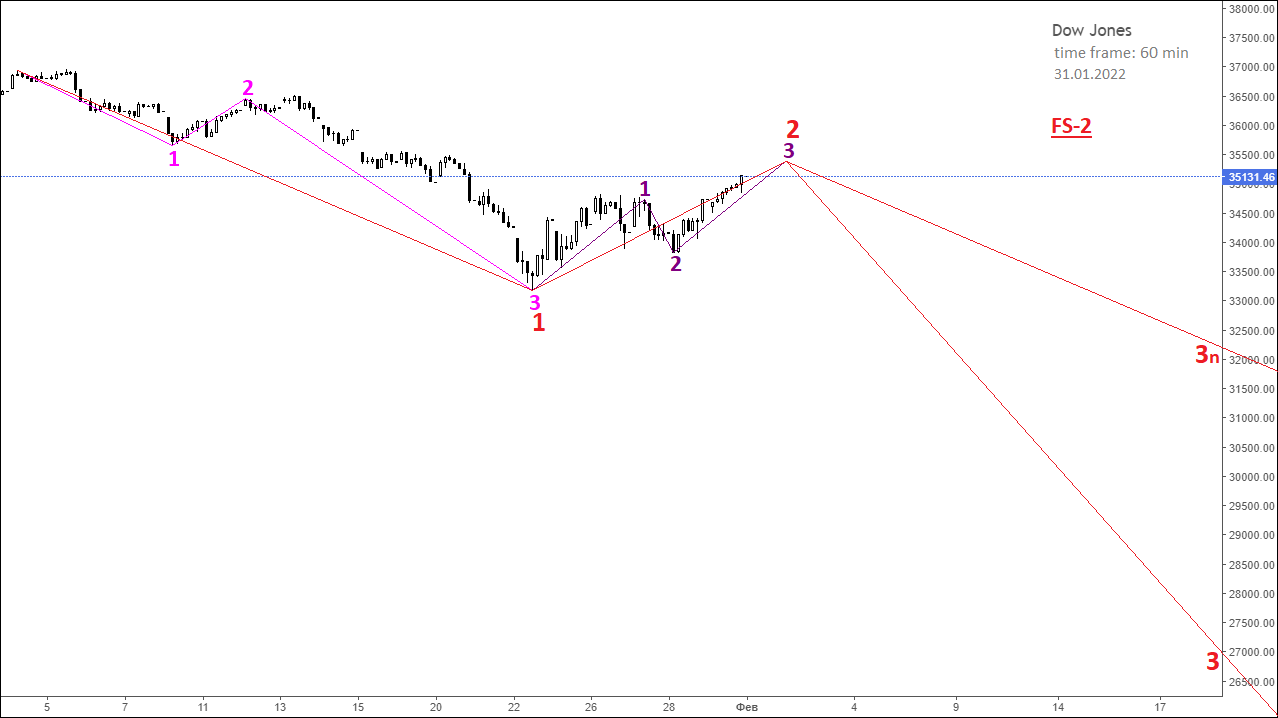
As of January 31, 2022, according to the alternative model for the development of the FS-2 fractal structure, we can say that the 2nd segment of the fractal, marked in red, is in the final stage of its formation.
After the completion of the purple fractal, which is the 2nd segment of the red fractal, the dynamics of the index will be downward as part of the formation of the 3rd segment of the red fractal.
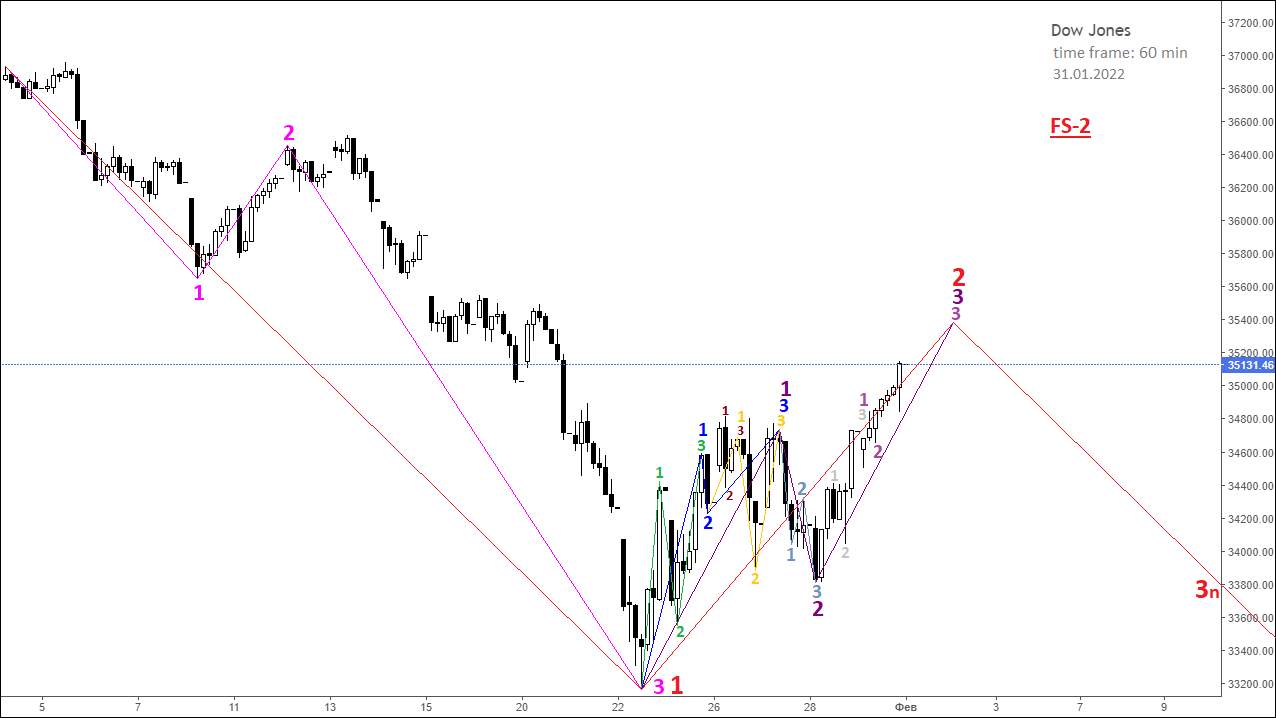
Dow Jones, fractal structure (time frame 1 hour / 01/31/2022)_continued.
Taking into account the existing fractal structure on the chart of the Dow Jones index, built with a time frame of 1 hour, according to an alternative model for the development of FS-2 dynamics, the most likely is the fall of the index values to the level of 27,000 points as part of the formation of the 3rd segment of the fractal, designated in red.
The decrease in the index values will begin after the completion of the 2nd segment of the red fractal.
Monitoring of current models of future price dynamics on the costforecast channel.


