
ETHUSD: Double Bottom Pattern Above $3,000
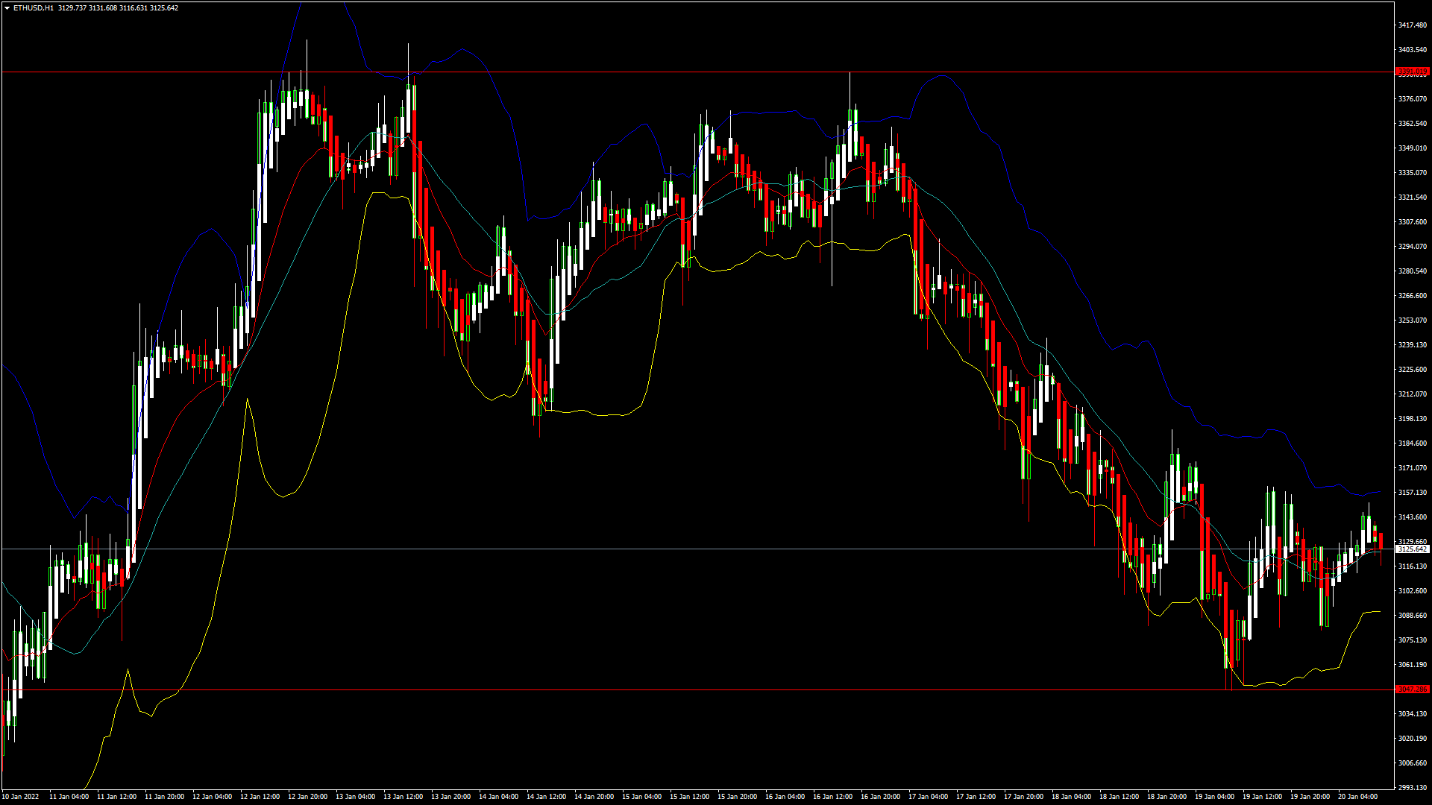
Ethereum was unable to sustain its bullish momentum this week, and after touching a high of $3,409 on 12th January, started declining against the US dollar.
ETHUSD touched an intraday low of $3,080 in the Asian trading session today, after which we can see some consolidation in its prices above the $3,000 handle.
We can clearly see a double-bottom pattern above the $3,000 handle which is a bullish reversal pattern and signifies the end of a downtrend and a shift towards an uptrend.
ETH is now trading just below its pivot levels of $3,131 and is moving in a consolidation channel. The price of ETHUSD is now testing its classic resistance levels of $3,138 and Fibonacci resistance level of $3,146, after which the path towards $3,300 will get cleared.
The relative strength index is at 49, indicating a NEUTRAL market and a move towards the consolidation phase after the decline.
We have detected an MA 20 crossover pattern above the $3,124 level which signifies a bullish trend reversal in the short-term.
Some of the technical indicators are giving a BUY signal.
ETH is now trading below the 100 hourly and 200 hourly simple moving averages.
- Ethereum consolidation is seen above the $3,000 mark
- Short-term range appears to be NEUTRAL
- Ultimate oscillator is indicating a NEUTRAL market
- Average true range is indicating LESSER market volatility
Ether Consolidation Channel Seen Above $3,000 ..More info: blog FXOpen


")
")
![[XAUUSD]: Weekly Liquidity Activation Points (timings), June 22-26, 2026](https://c.mql5.com/6/1013/splash-preview-771790.png "[XAUUSD]: Weekly Liquidity Activation Points (timings), June 22-26, 2026")