

This strategy is best used for Trend based trading, Scalping and Binary Options.
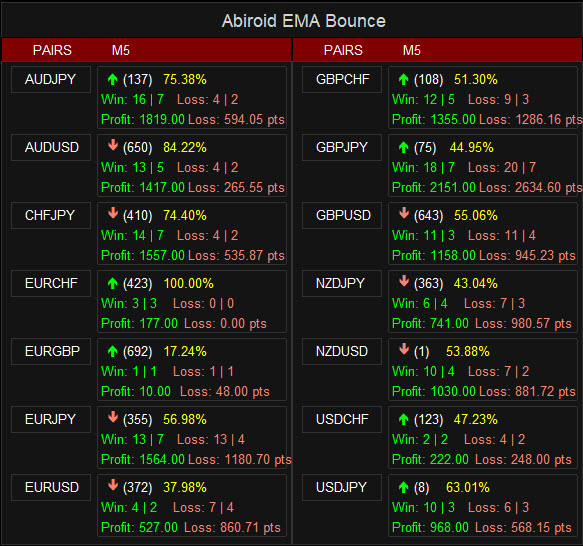
If Scanner percent is very less, means pair is ranging and not trending and should be avoided
Use fewer Max Past Bars in scanner like 100 or 500. To get most recent trend results.
Free scanner:
https://abiroid.com/product/ema-bounce-strategy
Video Tutorial:
SL/TP buffer values are for Win rate calculations only. Please use Support/Resistance or Pivot Points for better SL/TP on your actual trades.
Note:
Indicator has already reached more than 60+ settings. So I have stopped adding new features to it.
In case people do use it for an EA or with other indicators.. I need to keep settings less than 64. Because iCustom can have max 64 settings.
But I'll keep doing bug fixes.
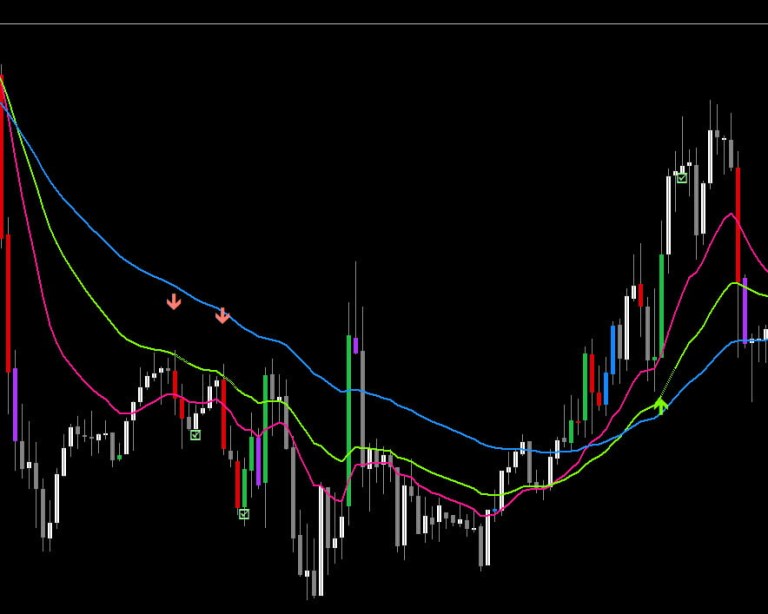
Strategy:
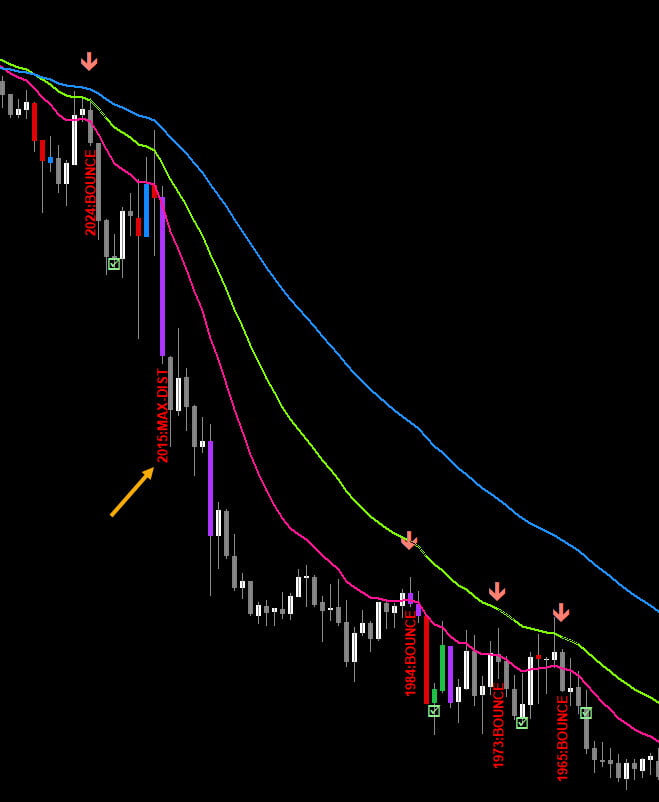
There are 3 EMAs: Faster, Medium and Slower. When Price is Trending, wait for Price to bounce an EMA and scalp at each bounce.
All Checks are Optional. And you can customize the indicator to your liking.
Attached Downloads:
- Volume Candles
- CHV Volatility
For a scanner to work, iCustom needs to be called. And iCustom requires less than 64 settings.
So, more options cannot be added to this strategy. As scanner options are maxed out :)
Features:
- Check if 3 MAs are Stacked
- Check Price Bounce Off MAs (Faster, Medium, Slower)
- Min Distance Between Faster and Medium MA Filter
- Max Distance Between Entry Price and Faster MA Filter
- High Volume Check
- Heiken Trend Check
- Volatility Check
- MA Slope Check
- Higher/Lower Timeframes MA Stacked check
- Higher/Lower Timeframes MA Slope check
- Max Spread Check
- Fixed Stop Loss and Take Profit Option
- Variable Stop Loss at any selected MA Option
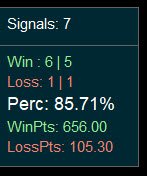
- Calculation of Profit Loss Points and Win/Loss Count and Profit Percentage
- Debug Texts on bars to show why signal skipped
Detailed Understanding:
Main Bounce Settings:
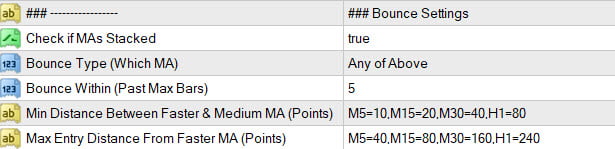
Check if 3MAs Stacked (Mandatory):
MA Stacking indicates price trend.
Up wards trend will have Faster MA on top, medium MA in the middle and Slower MA at the bottom.
And, downwards trend will have Faster MA at the bottom, medium MA in middle and Slower MA at the top:
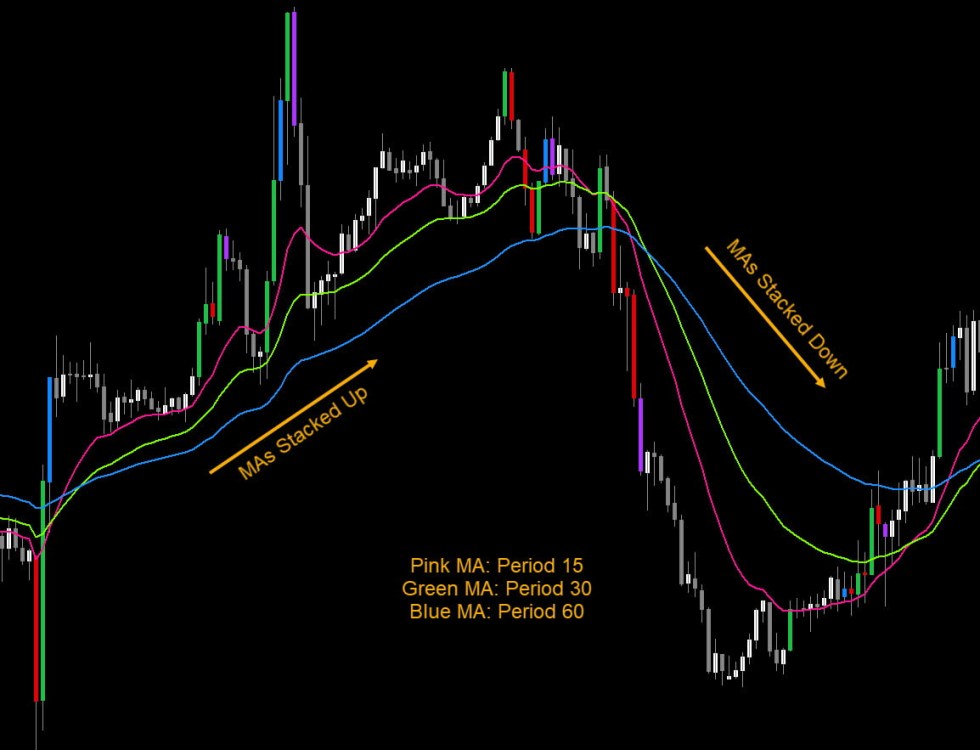
Trading towards trend is best, and trading while price is ranging is not profitable. So, this is a mandatory check. And all 3 MAs need to be stacked.
-
Check Price Bounce:
Price Bounce is when Close Price goes under an MA and back above it for BUY. Above an MA and back below it for SELL.
This should happen within given number of Bars: Bounce Within (Past Max Bars)
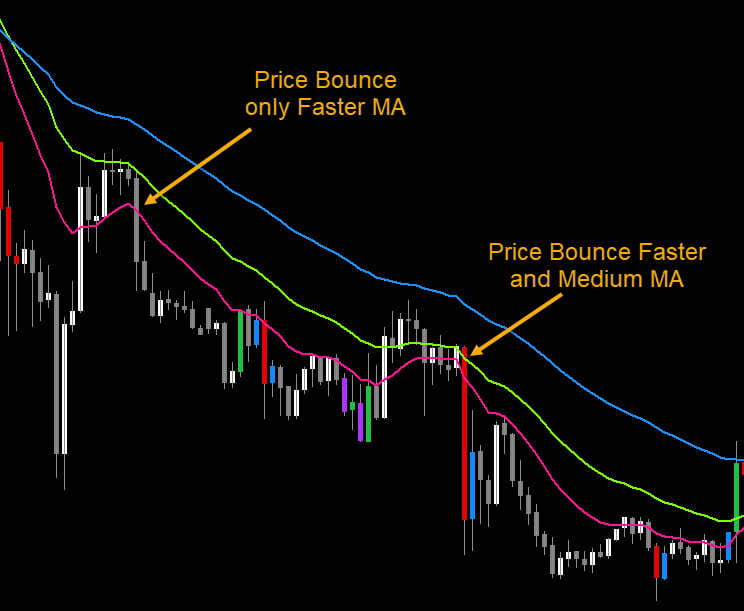
There are 4 possible Bounce Checks:
- Bounce Faster MA Only
- Bounce Faster and Medium MA
- Bounce All Three (Faster, Medium and Slower MA)
- Or Any of the Above
-
Skip Signal If Other MAs Bounced:
If true:
Suppose Bounce is for “Only Faster”: Then if price has crossed medium or slower MA also, then signal will be skipped.
Or if Bounce is for “Faster and Medium”: And price has crossed slower MA as well, then signal skipped.
This will make sure that price will only cross the intended MAs.
If false:
Then it will only check if intended MAs are crossed. Won’t skip signals if other unintended MAs also crossed.
-
Min Distance Between Faster and Medium MA:
If MAs are too close together, even if stacked, then it means that price is in a range. So not a good time to trade:
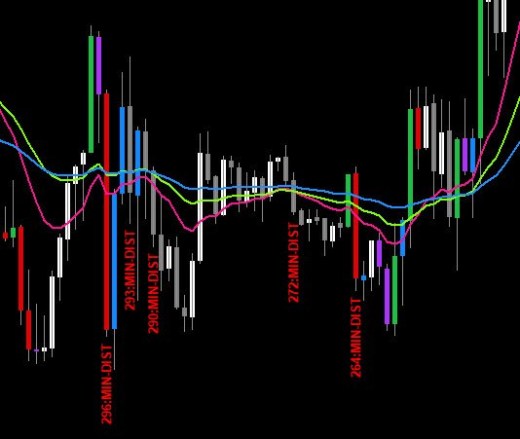
This check skips signals when Faster and Medium MAs are too close together. MA Distances are in points like this:
M5=10,M15=20,M30=40,H1=80
Where you can have different points for different timeframes. This check is optional. To keep it off just leave it blank.
Debug Texts will show bar number and “MIN-DIST” indicating that signal was skipped because MAs were closer than Min Distance defined.
-
Max Distance Between Entry and Faster MA:
If price has already gone too far, when a signal occurs, then it’s not safe to trade. As after a large candle breakout, price might retrace back to MA:
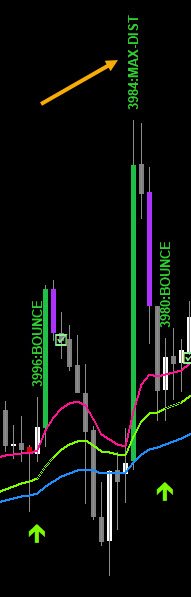
But this is not always the case. Sometimes despite a large breakout, price still keeps moving on.
So, this check is optional. To keep it off just leave it blank.
Use crosshairs tool to calculate the best Min/Max point distances:
https://www.mql5.com/en/blogs/post/747462
3 MA Settings:
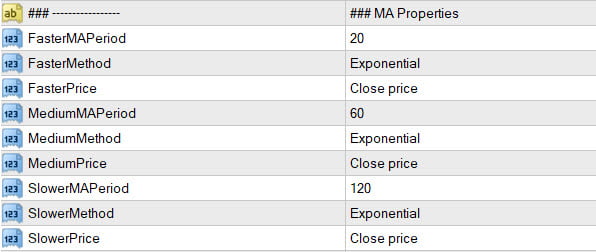
You can define the Faster, Medium and Slower MAs here. Be sure to keep faster period as less, medium in middle and slowest as largest period.
Otherwise the features won’t work properly.
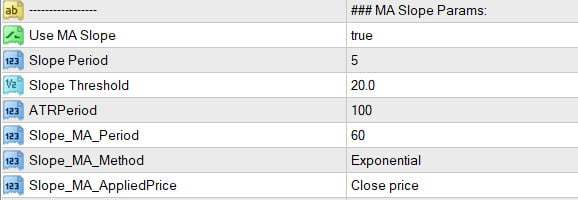
MA Slope Check:
Use slope check to see if that MA is sloped Up or Down for Buy or Sell.
It uses the Slope MA Indicator available here:
https://www.mql5.com/en/market/product/77212/
https://www.mql5.com/en/blogs/post/747651
MA Slope Video Tutorial:
For Buy, it will check if slope is above the Slope Threshold. For Sell, it will check if slope is below the negative -Slope Threshold.
It uses the Radian Normalized Slope type for finding the MA’s slope. Normalizing the slope values are necessary, so that all timeframes have similar slope values.
Since this slope is normalized, it’s values can change a little over time.
But slope is calculated only once for all bars at the beginning. And then only for new bars since then. So there is no repainting. But if you reload the indicator all over again, then slope values might change.
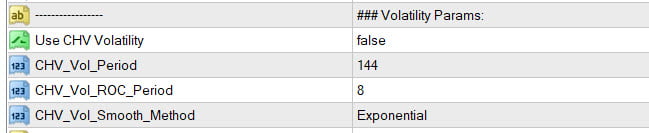
Volatility Check:
It uses CHV Volatility to check if pair is currently having a good volatility. This strategy works only in trending markets when volatility is good.
It doesn’t work when market is ranging or in low volatility. So use this setting to find the best trades.
Other Settings:
-
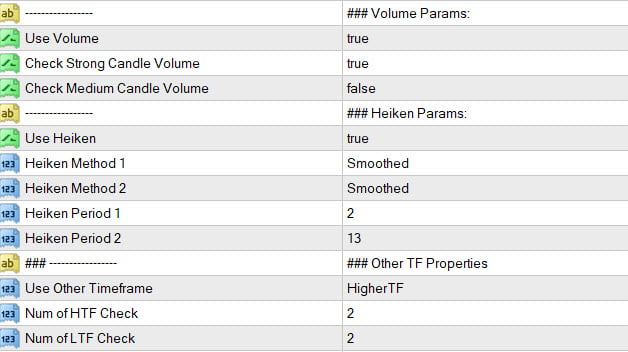
Volume Check:
You can select if you want the signal bar to have a High or Medium Volume.
It uses the indicator VolumeCandles.ex4 for Volume calculations.
-
Heiken Check:
Use Heiken to check if current heiken trend is aligned with signal direction. Set Heiken period 2 value as more like 13, for smoother heiken and longer trends.
Set heiken period 2 value as low like 4 for smaller trend scalping.
-
Higher and Lower Timeframes MA Stacking Check:
Check if MAs are stacked on selected number of Higher or Lower Timeframes.
If current timeframe is H1 and Num of HTF is 2, and signal is BUY, then it will check if H4 and D1 both have MAs stacked in an Uptrend. And vice-versa for SELL.
Same way, if Num of LTF is 2, then it will check M15 and M30 for Upwards or downwards trend for BUY or SELL signals respectively.
When scalping longer trends, it is better to check if current TF trend is aligned with higher timeframe trend.
Sometimes when a trend is ending, it will end on lower timeframes first. So when doing smaller and quicker scalping, use Lower TF trend align instead.
-
Higher and Lower Timeframes MA Slope Check:
You can alternatively use MA Slope from Higher or Lower Timeframes. It will use the same Slope settings from those defined in Slope Check above.
Using both LTF and HTF together will limit signals a lot.
Select None from drop-down to disable both.
Win/Loss Calculations:
- Set Fixed SL and TP Distances (Optional)
- Or Variable StopLoss at Fast, medium or slow MA
- Set Number of Expiry Bars
- If SL/TP not set, then Expiry Bars is used to see if profit or loss
Signal Calculations:
- Wait Bars between Signals
Note:
The prices and point calculations don’t use the Ask/Bid or Spread values. They only use the closing price.
This is because MT4 provides the Ask/Bid price for current bar only.
And for previous bars, it will be very difficult to know the actual spread.
So, please use the Point Calculations for Reference only. And if scalping, only trade pairs with a very low spread.
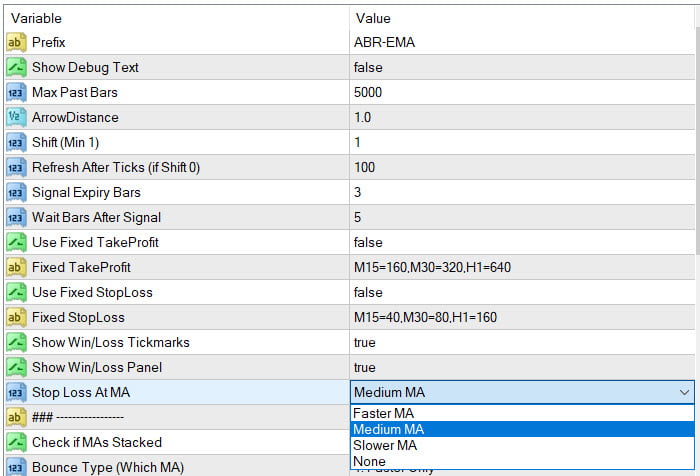
Other Features:
- Debug Text to show Why a Signal is skipped
- Select Start Shift and Max Past Bars to Scan
- Adjust Arrows
- Refresh Every given number of Ticks
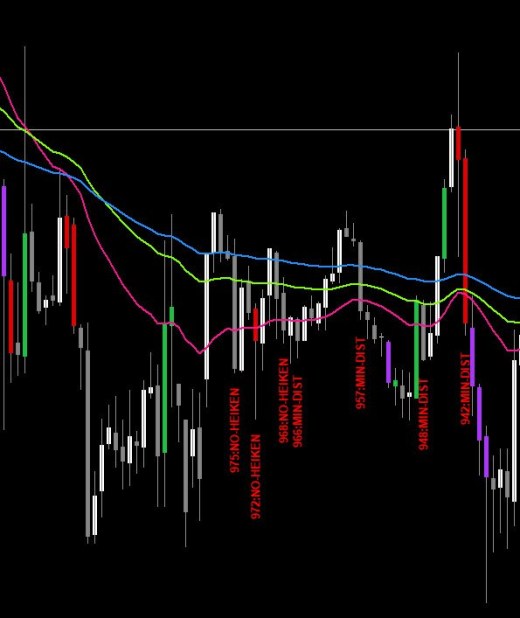
Debug Message Meanings:
Debug messages show what’s happening behind the scenes :)
Debug messages and the bar numbers are for reference only. Arrows are calculated only once to prevent repainting from Slope.
So, as new bars form, the bar numbers will not be correct. Reload the indicator for correct bar numbers in debug messages.
The green messages indicate that the signal was BUY and red messages indicate that the signal was SELL.
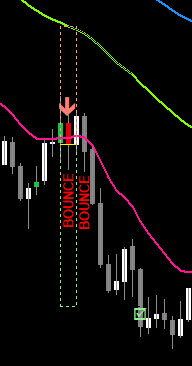
This message is the only one which shows that a signal has happened:
- BOUNCE
All other messages show why a signal was skipped:
- MIN-DIST
The distance between faster and medium MA is less than the MIN point distance set in settings for that timeframe
- MAX-DIST
The distance between close price (signal entry price) and faster MA is more than the MAX point distance set in settings for that timeframe
- NO-CHV
CHV Volatility is low. So skipped signal
- NO-VOL
High or Medium Volume not there
- NO-HEIKEN
Heiken Trend is not aligned with current signal type BUY/SELL
- NO-SLOPE
Current Timeframe MA slope is not beyond threshold. For BUY, it should be above Threshold. For SELL it should be below -Threshold. Otherwise signal is skipped
- NO-SLOPE-HTF
Higher timeframe MA Slope is not beyond threshold.
- NO-SLOPE-LTF
Lower timeframe MA Slope is not beyond threshold.
- NO-MA-HTF
Higher timeframe MAs are not stacked in same direction as signal type BUY/SELL
- NO-MA-LTF
Lower timeframe MAs are not stacked in same direction as signal type BUY/SELL
- BOUNCE2
If “Skip Signal If Other MAs Bounced” is true and Medium MA is crossed. Then signal is skipped.
- BOUNCE3
If “Skip Signal If Other MAs Bounced” is true and Slower MA is crossed. Then signal is skipped.
- NO-BOUNCE2
If Bounce Check is for First and Medium, but Medium is not crossed within “Bounce Within Max Bars”. Then signal is skipped.
- NO-BOUNCE3
If Bounce Check is for All 3 MAs, but slower is not crossed within “Bounce Within Max Bars”. Then signal is skipped.
Scanner:
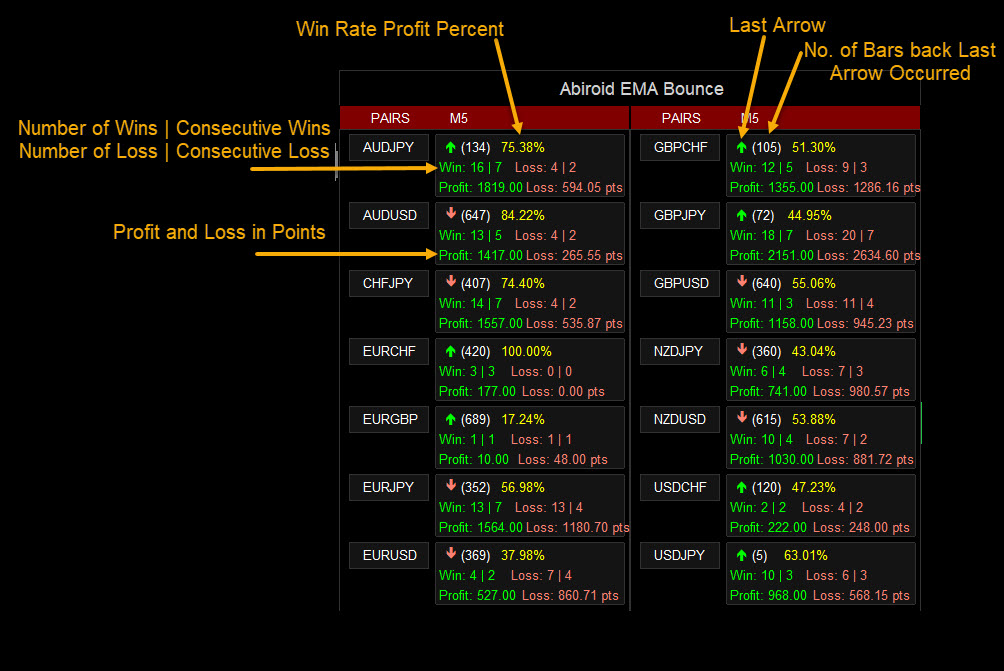
Read detailed scanner specific settings here:
https://www.mql5.com/en/blogs/post/747456
All other scanner settings are same as Arrows Indicator. Both Arrows and Scanner set files can be used interchangeably.
If you make change to one, just load the set file to the other.
How To Trade:
Trade only trending market. When a good trend has started. And you see the 3 MAs separate.
Default settings are best for M5 timeframe scalping.
Keeping tight stop loss and more take profit will ensure that profit points ratio is much higher.
Be Careful:
Don’t trade during ranging markets. As price bouncing off EMAs only works during good trends.
And make sure volatility is good.
Don’t trade when market is whipsawing and making sudden ups and downs:
https://www.investopedia.com/terms/w/whipsaw.asp
https://www.investopedia.com/terms/c/choppymarket.asp
Be careful during news events as trends might change suddenly.
Debugging:
Strategy Tester in MT4 allows only a single timeframe and single pair for testing.
So if using higher or lower timeframe Slopes just note that strategy tester can give incorrect values:
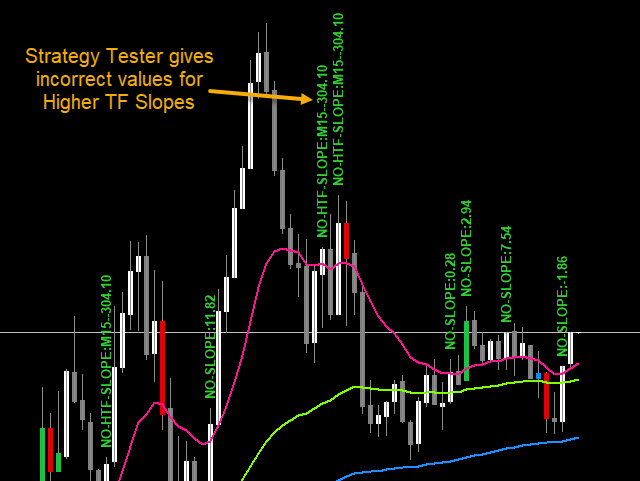
So, strategy tester isn't reliable when using multi-timeframe options.
Changelog:
v1.0 Base version
v1.1
Fixed Scanner spacing
Added StopLoss/TakeProfit Values
Fixed bug no refresh when Total 0
Added winrate% to alerts
v1.2 Added SL/TP Arrow Boxes option


")
")