

Tick Signal Guide
MT4: www.mql5.com/en/market/product/70241
In this post, we will learn how to run the indicator and get acquainted with the different sections
Purchase Guide:
To buy any product on the site, you must first click on the buy button:
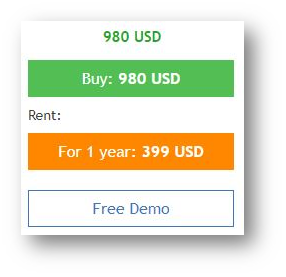
If there is a rent option, you can rent the indicator for the specified period.
After clicking the buy button, click one of the payment method options:
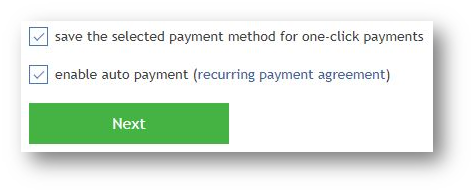
Then accept the rules and move on to the next step.
After purchase, install the indicator.
Then run it.
Training to run the indicator:
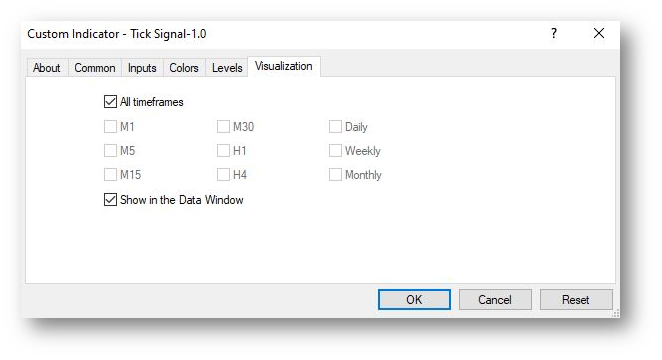
After running the indicator, you will see this page:
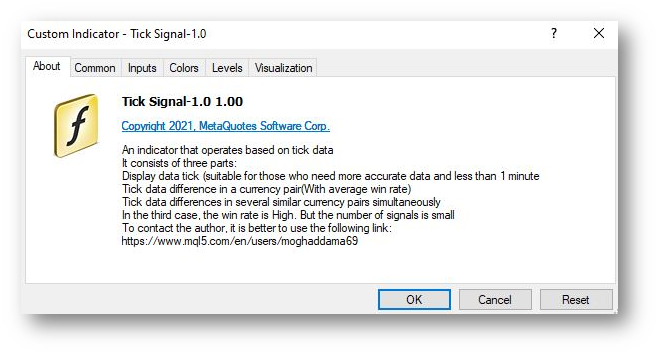
In this section, you will see brief information about the indicator.
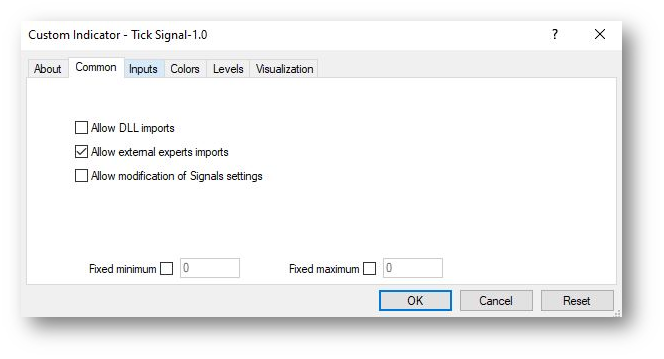
In the next section, you will see the BASIC indicator settings. It is better not to change these settings.
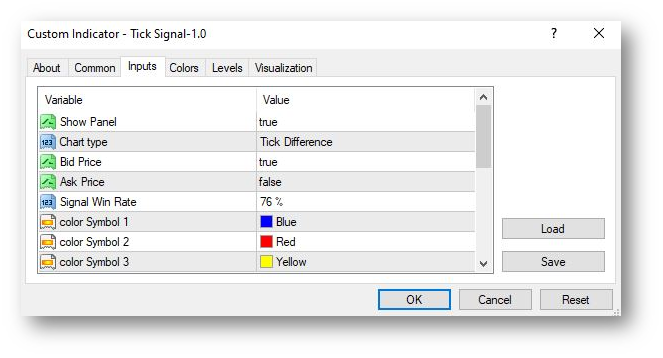
In the next section, you will see the main settings and inputs of the indicator. If you are unfamiliar with these settings, read the settings Post.
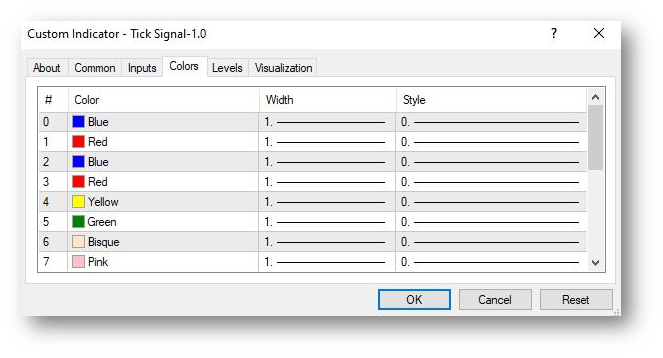
In the next section, you can change the color of the charts and indicators. You can also increase the thickness of the chart. You can also change the line type. These settings are only for better display of the indicator and the settings are not very important.
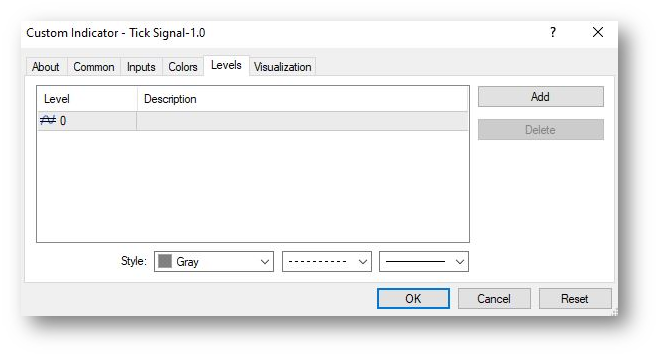
In the next section, you will see the settings for the levels. It is better not to change these settings.
In the last part, you set the time frame in which the indicator will run. It is better not to change the settings of this section either.
Panel guide:
We have two types of panels. The first panel is for the second part.
As you know, this indicator consists of three indicators or three parts. The second part is about the difference between the ticks.
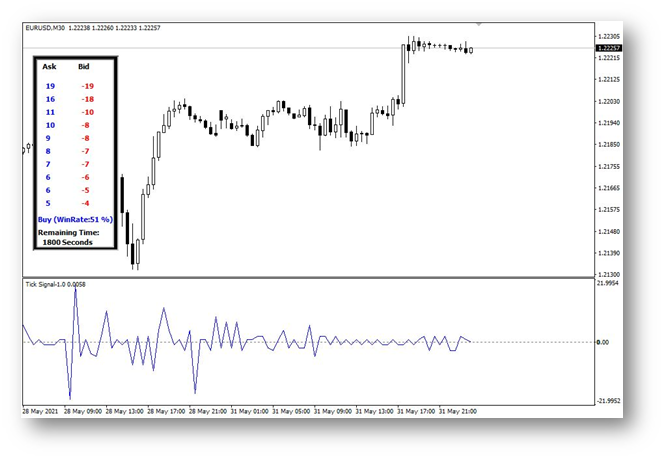
You will see the largest ticks in the panel. This panel is updated every half hour.
You will see the time of the next update at the bottom of the panel.
Note that the update time may not work in the back test. But in live, it definitely works. This time is based on seconds.
In this panel, you have two columns. In the left column, you will see the biggest ticks related to “Ask” Price. And in the right column, you will see the biggest ticks related to the price of “Bid”.
At the bottom of the panel, you can see if you have a signal. If the signal is Buy, it is blue. And if the signal is Sell, it is red.
If the signal is larger than the Win rate you specified in the settings, you will see the signal in the graph.
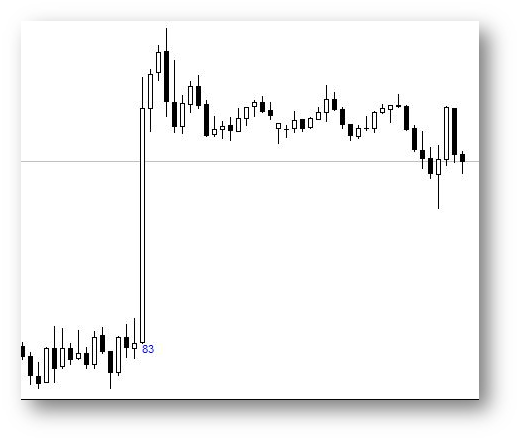
For example, in this chart, you have a buy signal, with a win range of 83%. This is a great win rate.
Next panel:
You have another panel in the third indicator, which calculates several currency pairs simultaneously.
In this section, you will see the signal of each currency pair separately.

In this panel, you will see the signal of each currency pair. This panel and this part are only visible in live. In backtest, it does not work. Because in the back test, the tick data of other currency pairs is not available.
So, to use this section, you must download the data of different currency pairs. Then you see the signal of different currency pairs. If we have a buy signal, it is marked in blue. And the sell signal is seen in red.
At the bottom of the panel, you can see the signal win rate. This win rate is a signal based on the total 14 currency pairs you see in the panel. At the bottom of the panel, you will see the time left until the signal is updated. This panel is updated every 30 minutes.


![[Two Different Approaches to Market Timing]: The Spiral Calendar and the VISTmany Research Project](https://c.mql5.com/6/1012/splash-preview-771691.png "[Two Different Approaches to Market Timing]: The Spiral Calendar and the VISTmany Research Project")

