

TREND INDICATOR WITH A PROFIT PERCENTAGE OF 70-90%
Increase your trading performance on the very first day of using it!
![]()
Main advantages:
- The total profit of transactions exceeds the total loss by more than 2 times;
- Automatic selection of the best settings;
- Timely notifications: pop-up, phone, email;
- Detailed statistics for the last 100 signals;
![]()
About the indicator
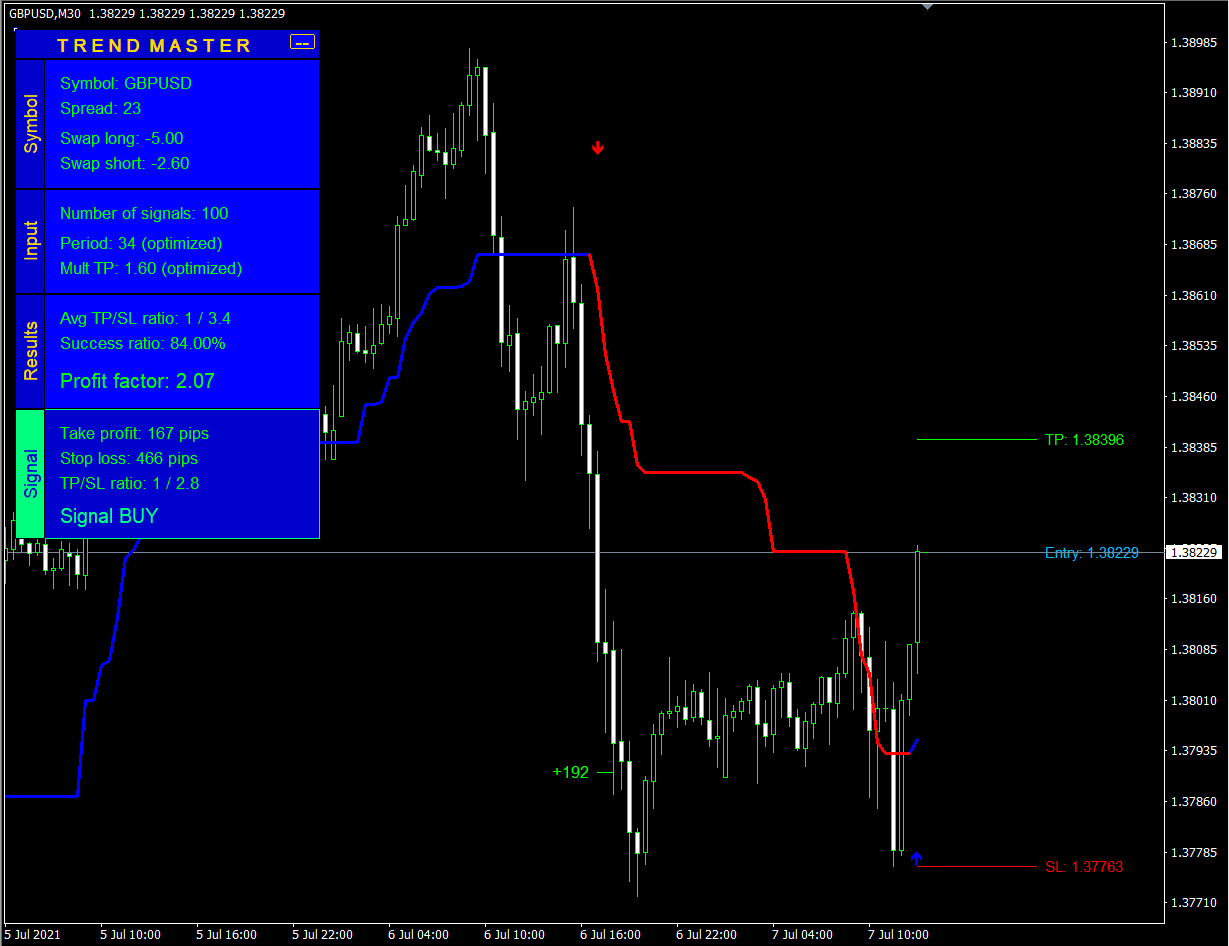
The indicator consists of four parts: a signal line, signal arrows, TP / SL reach lines and an information panel.
The Trend Master PRO plotting algorithm is based on breaking through support / resistance levels.
Depending on the strength of the current trend, these levels are closer / farther from the price.
If the candlestick closes completely behind the calculated level, then the signal line changes its color and an arrow (signal) appears.
The dashboard has detailed statistics for the last 100 signals of the indicator (you can change the value in the settings).
![]()
Signals
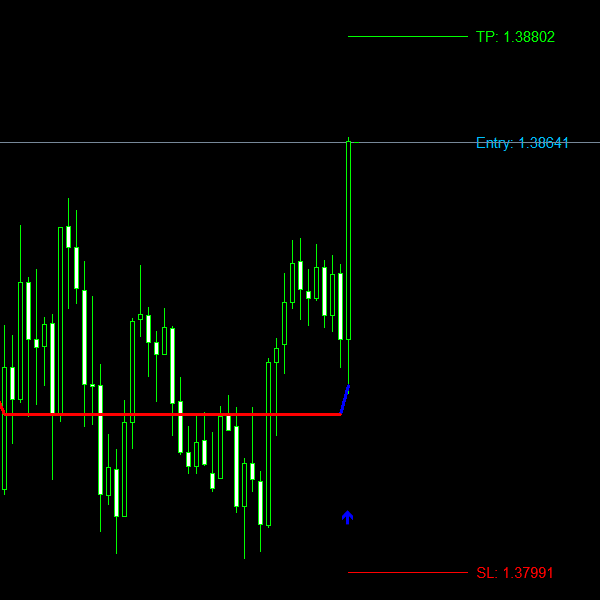
The signal to open an order is the appearance of an up / down arrow on the previous candlestick. A signal notification appears immediately with an arrow: direction, pair, timeframe, current time.
Simultaneously with the signal, the following are drawn: the line for opening a trade, the recommended take profit, the recommended stop loss. All line colors are customizable.
The take profit level is at the ATR distance with a period that corresponds to the signal line. This distance is multiplied by a certain coefficient, which the indicator automatically calculates (it is possible to set the coefficient value manually).
The stop loss level is set at the nearest support / resistance level, which is also automatically determined by the indicator.
![]()
Infopanel
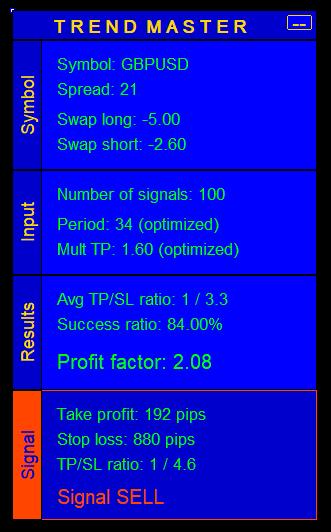
The dashboard has 4 information blocks: (1) data on a symbol, (2) basic indicator settings, (3) statistics on indicator signals, and (4) a block of the current signal (displayed only at the moment of a signal candle).
Each of the blocks can be enabled / disabled in the indicator settings.
The information panel can be collapsed using the button in the upper right corner, and also moved using the dot in the upper left corner. After moving, the panel can be fixed by double-clicking the left mouse button on a point in the corner.
First block - Symbol data
- Current symbol;
- Current spread;
- Swap a buy position for 1 lot of a trade;
- Swap a sell position for 1 lot of a trade .
The second block - Basic settings of the indicator
- The number of signals for which statistics are collected in the 3rd block;
- Signal line period. If the period is optimized using the indicator, an additional inscription "(optimized)" is displayed;
- Take profit multiplier. If the value is optimized using the indicator, an additional inscription "(optimized)" is displayed.
Third block - Signals statistics
- Average take profit to stop loss ratio for all signals. Displayed as "1 / x", where x = SL / TP;
- The probability of reaching a take profit for all signals. It is displayed as a percentage and is calculated using the formula: "number of profitable trades" / "number of all trades" * 100;
- The overall profit factor. It is displayed as a fractional number and is calculated using the formula: "total profit in pips" / "total loss in pips".
The fourth block - Current signal (displayed only at the moment of the signal candle)
- Current take profit in pips;
- Current stop loss in pips;
- Take profit to stop loss ratio. Displayed as "1 / x", where x = SL / TP;
- Signal direction.
![]()
Settings
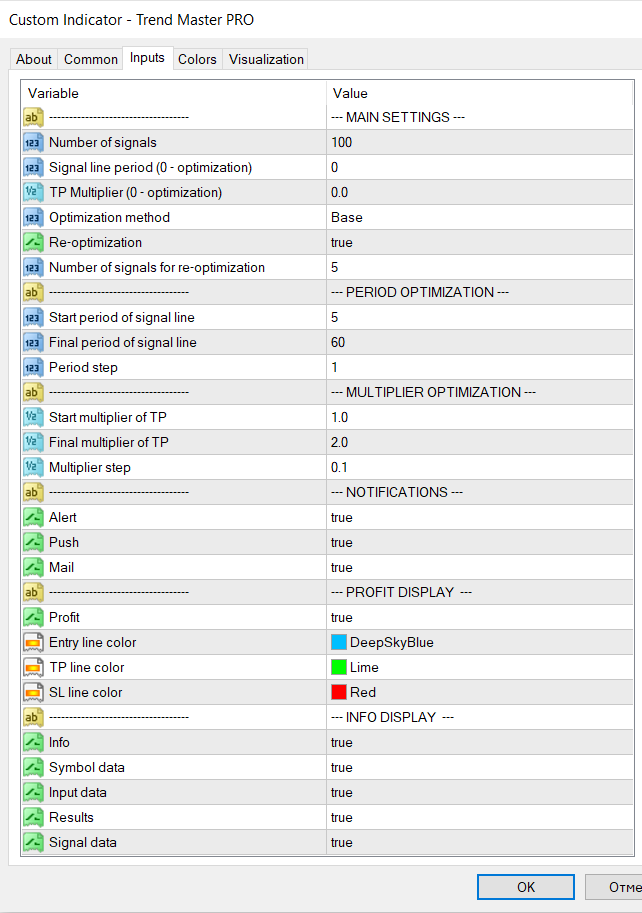
Group "MAIN SETTINGS"
- The number of signals that are used for optimization and statistics are displayed;
- Signal line period. If the value is 0, the period is optimized (the indicator calculates the best value automatically);
- Take profit multiplier. If the value is 0 , the multiplier is optimized (the indicator calculates the best value automatically);
- Optimization method: basic (Base) or full (Full). It is recommended to use the basic type in order not to load the terminal too much;
- Re-optimization (true / false). If this parameter is enabled, then every 5 new signals (configurable) will be automatically optimized;
- Number of new signals for re-optimization;
- The maximum number of history bars (used only in MT5). This parameter is necessary in order not to overload the indicator with calculations for all historical data.
Group "PERIOD OPTIMIZATION"
- The starting value of the period when it is optimized;
- The last value of the period when it is optimized;
- Period step.
Group "MULTIPLIER OPTIMIZATION"
- The starting value of the take profit multiplier when it is optimized ;
- The last value of the take profit multiplier when it is optimized ;
- Take profit multiplier step.
Group "NOTIFICATIONS" (type of notification when a signal arrives)
- Pop-up in terminal (true / false);
- Phone notification (true / false);
- Email notification (true / false).
Group "PROFIT DISPLAY"
- Displaying stop loss / take profit levels (true / false);
- Display color of the trade entry level;
- Color of the take profit level display ;
- Color of the stop loss level display.
Group "INFO DISPLAY"
- Displaying the information panel (true / false);
- Display block №1 (true / false);
- Display block №2 (true / false);
- Display block №3 (true / false);
- Display block №4 (true / false).
![]()
Reviews

All reviews about the indicator follow the link: https://www.mql5.com/en/market/product/68405#!tab=reviews
![]()
Recommendations for use in trading:
When choosing a trading strategy for trading, you need to take into account the main advantages and disadvantages of the indicator.
The main drawback is the large take profit to stop loss ratio. On average, it is equal to 1/4.
The main advantage is a large percentage of profit. On average, it is 70-90%.
Due to this, the total profit generally exceeds the total loss by at least 1.5 times.
Based on the above facts, I recommend:
- Before the first installation of the indicator on any pair, load history on it (for correct optimization);
- Choose pairs with a large profit factor;
- Trade on signals with a TP / SL ratio less than 1/4 (it will be displayed in the signal block);
- Open the main deal on an arrow signal (a deal to break through the level);
- If the main deal does not have time to close by TP and the price reaches the signal line, open an additional deal with a double lot. For this transaction, the TP / SL ratio will be about 1/1, while the probability of reaching TP is still the same 90%;
- Open the initial lot of the main transaction in accordance with the money management;
- Set stop loss and take profit at the levels recommended by the indicator.
![]()
About the author
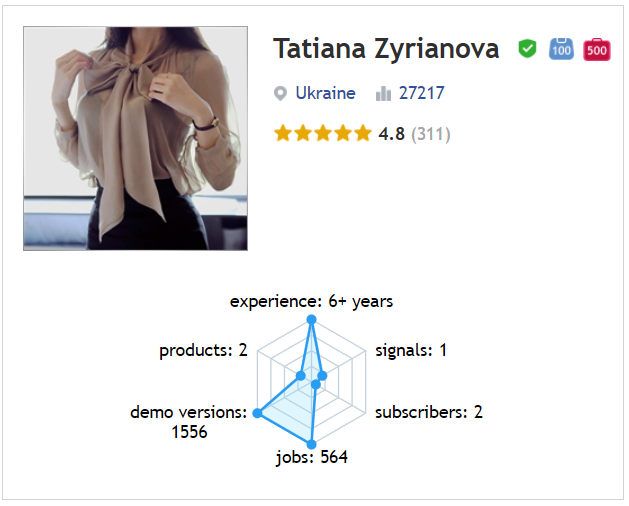
My name is Tatiana Zyrianova and I have been a trader and developer of profitable trading robots, indicators and scripts since 2014.
In my portfolio I have more than 500 successfully completed orders.
![]()


![]()


")
