MA bounce indicator
Basic idea
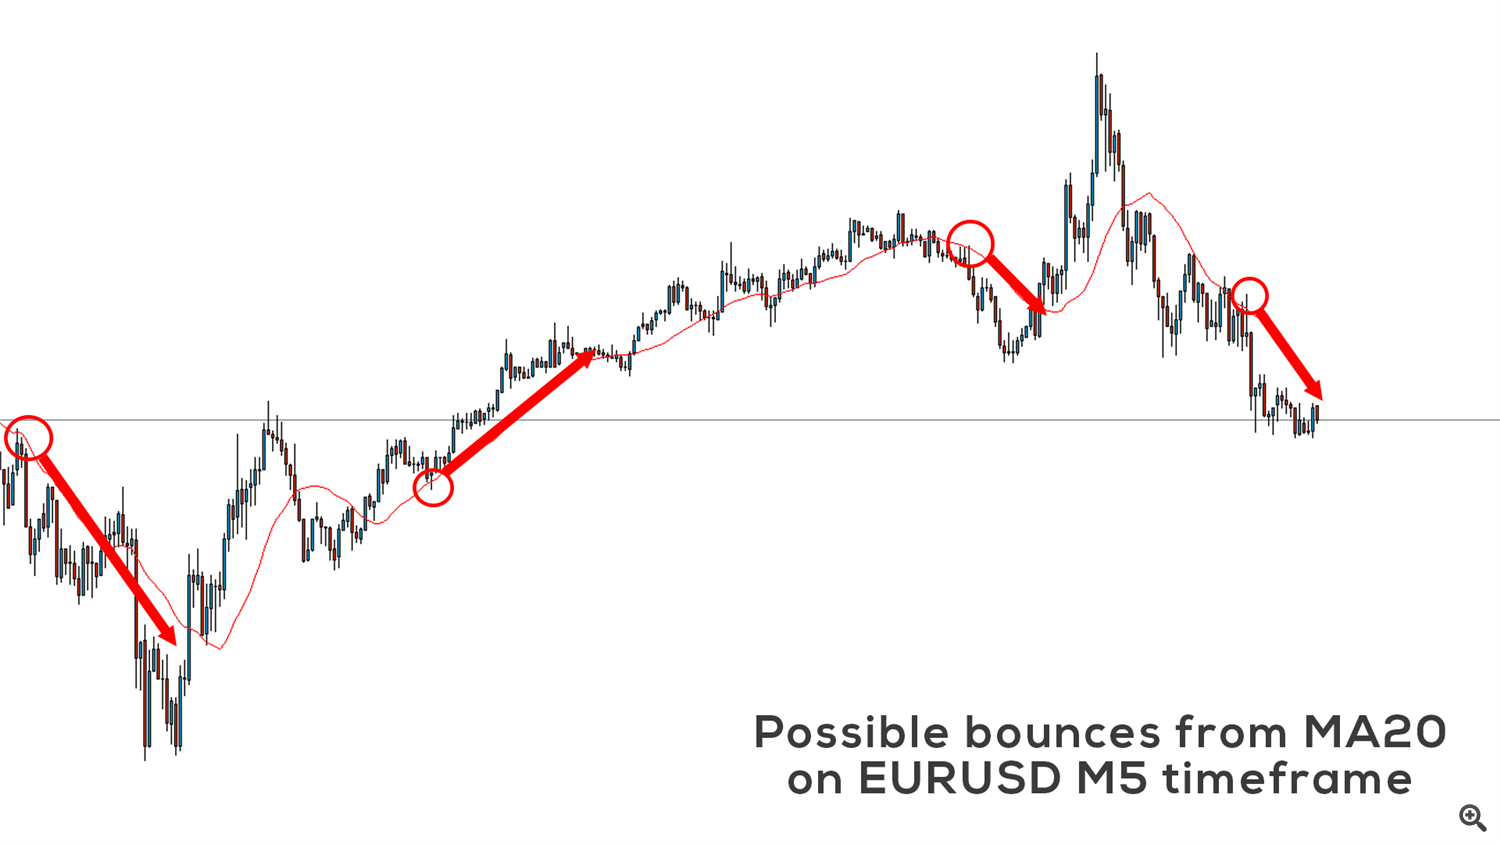
Moving average is widely used technical indicator, which in many cases acts as dynamic support or resistance. It is important to use correct period of moving average, but mostly used are periods 20 (sometimes 32) and 200. This is the basic idea of my MA bounce indicator, which indicates possible bounces from defined moving average. Of course, without filtering, there would be many false signals, because price sometimes tends to oscillate around moving average. This is why MA bounce uses combination of trend indicators and oscillators for filtering bounce signals.
MA bounce settings
MA bounce indicator can operate in 2 modes: Proximity sensor and Bounce indicator. Proximity sensor is just simple alert indicator, which gives you alert when price will be in defined range from Moving average.
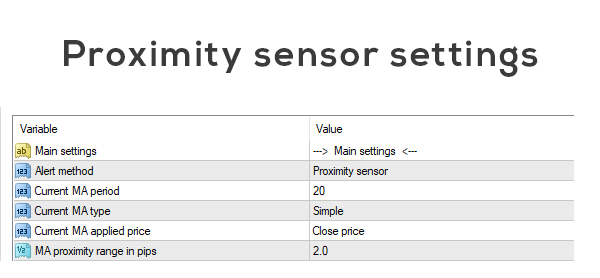
Bounce indicator is more complex indicator which gives multiple BUY/SELL signals and additional filtering indicators as well. Now I will try to explain functionality of every Bounce indicator settings.
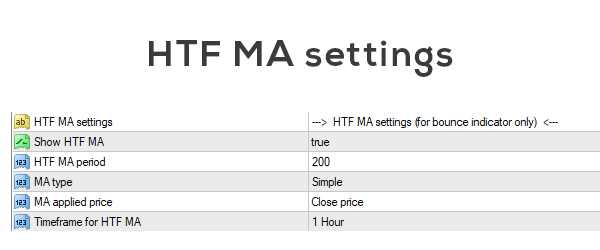
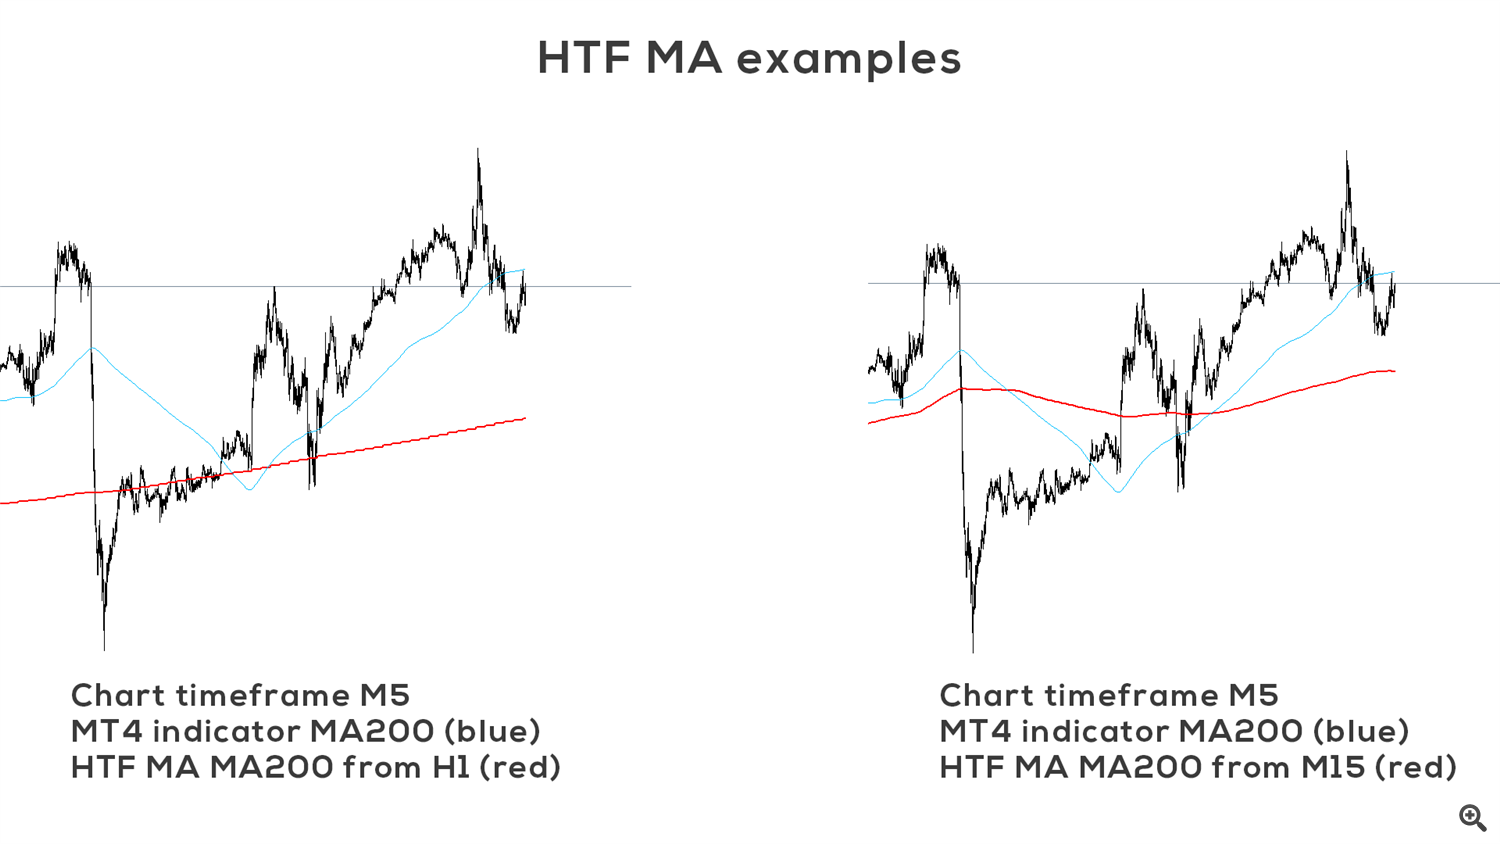
HTF MA is simply moving average from higher timeframe. You can set MA period, MA type, MA applied price and timeframe which will be used for calculation of HTF MA. If you use current TF for HTF MA, you will get classic moving average for your current chart.
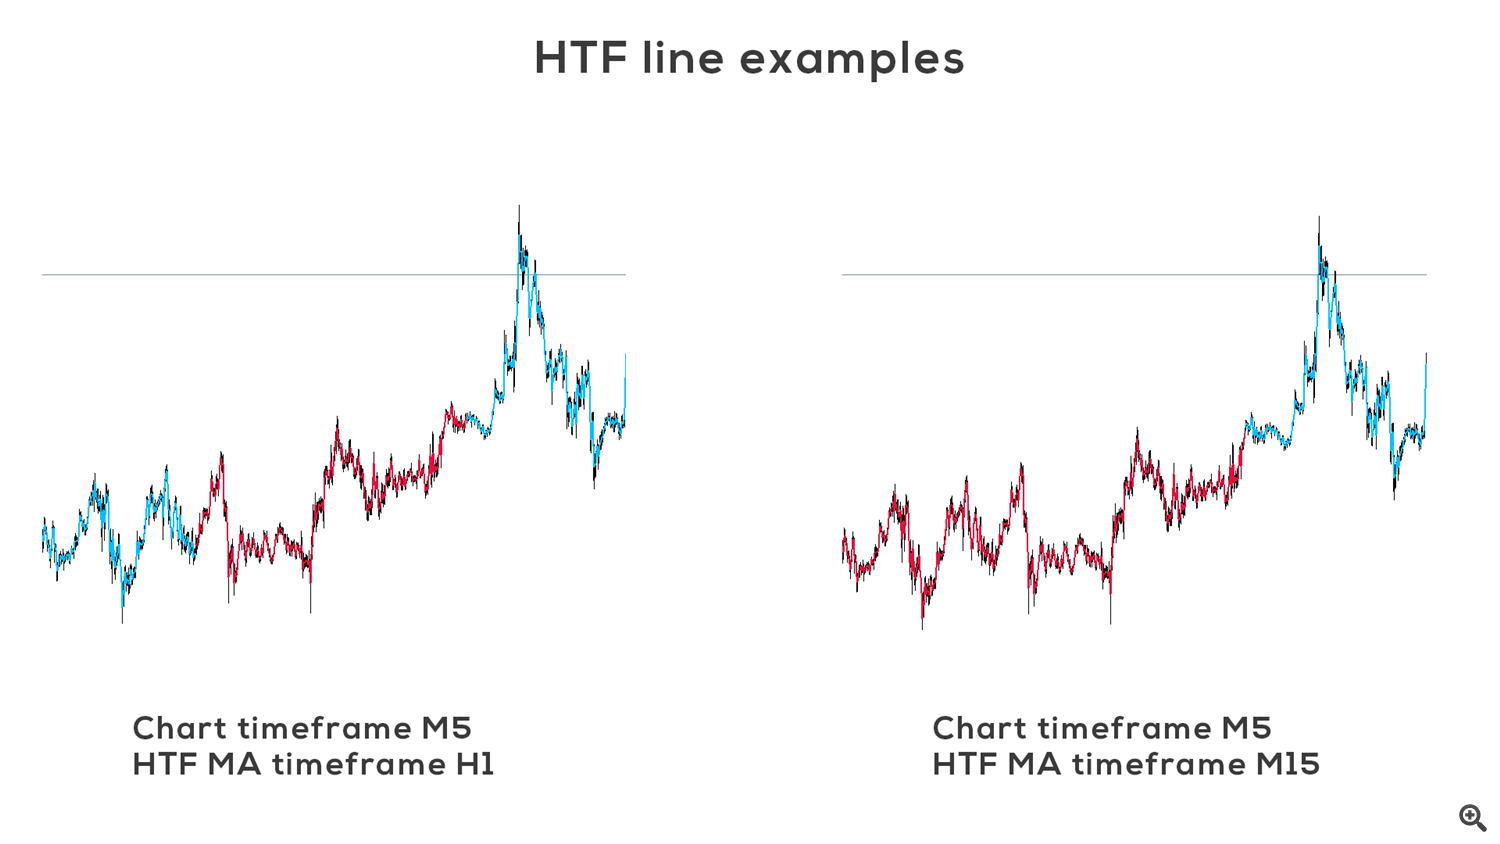
HTF MA can be used for filtering or it can be used as another moving average which will act as dynamic support/resistance. One good rule is to enter BUY only when price is above HTF MA, or SELL when price is below HTF MA. Another indicator which can be used for filtering is HTF line. HTF line is color representation of trend from higher timeframe selected in Timeframe for HTF MA option.
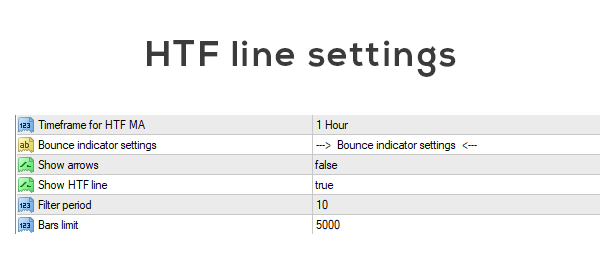
HTF line is calculated from several trend indicators and oscillators for determining trend. Color change of HTF line can be sometimes good indicator for entering trade. Keep in mind that HTF line doesn't represent exactly all market conditions, because there is no indication of ranging market. For example, if all conditions for downtrend are met, HTF line will be red until all conditions for uptrend are met. Reason for this approach, is to eliminate frequent changing color of HTF line, which will result in many false signals. HTF line can work in 2 modes - long term and short term. Short term mode calculates market conditions from current timeframe and reacts faster to changes in trend. On the other hand, long term mode is calculated from higher timeframe, therefore it reacts much slower on changes in trend.
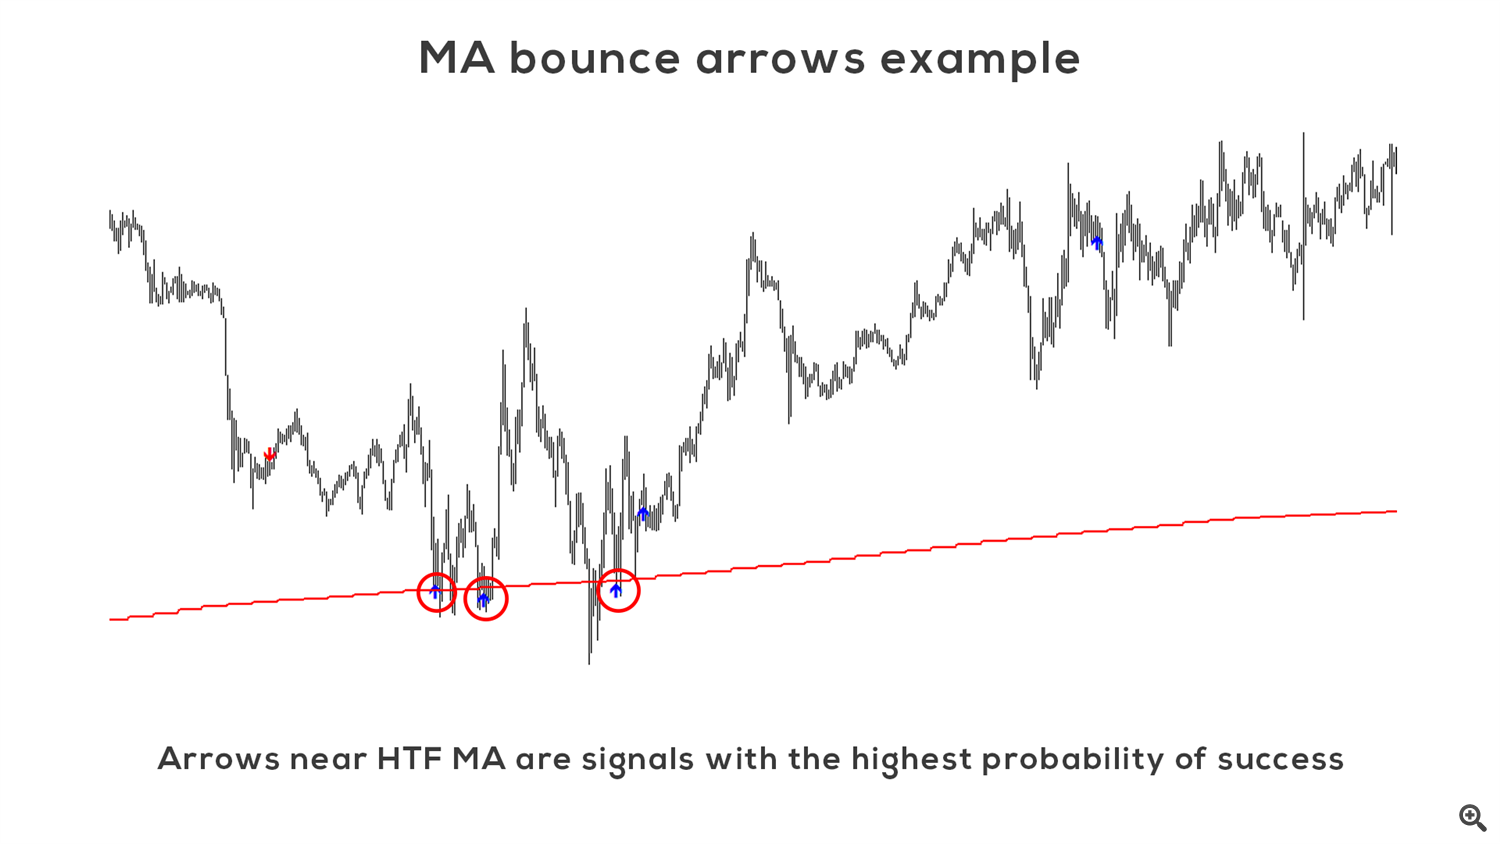
MA bounce arrows are main part of this indicator. They signalize when there is high probability that price bunce UP or DOWN from defined MA. They signalize bounce from HTF MA as well. Bounces from HTF MA are signals with pretty high probability of success. But I don't recommend using arrows without further filtering for entering the trade. I implemented 3 filtering tools which I will describe later, and I will show you some trading examples as well.
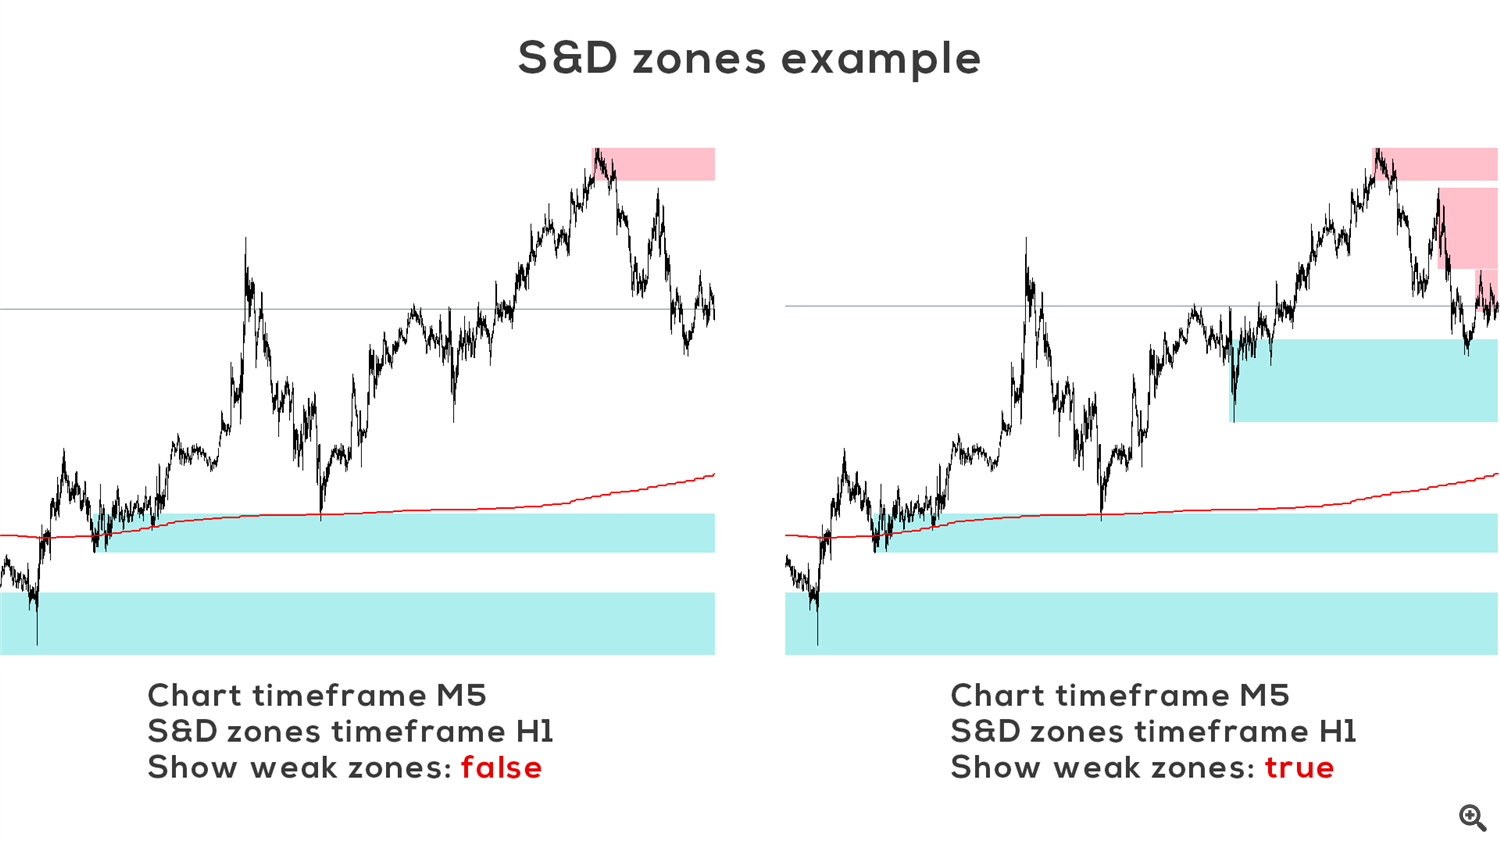
First great tool for filtering is indicator of supply and demand zones. User can choose timeframe which will be used for S&D zones calculation, colors for zones and if weak zones should be displayed as well.
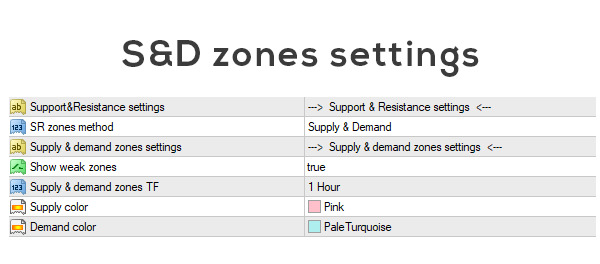
Show weak zones option simply show every possible supply or demand zone (price touched zone at least 1 time). If you disable this option, indicator show only strong (price touched zone at least 2 times) and you will end up with more clear chart.
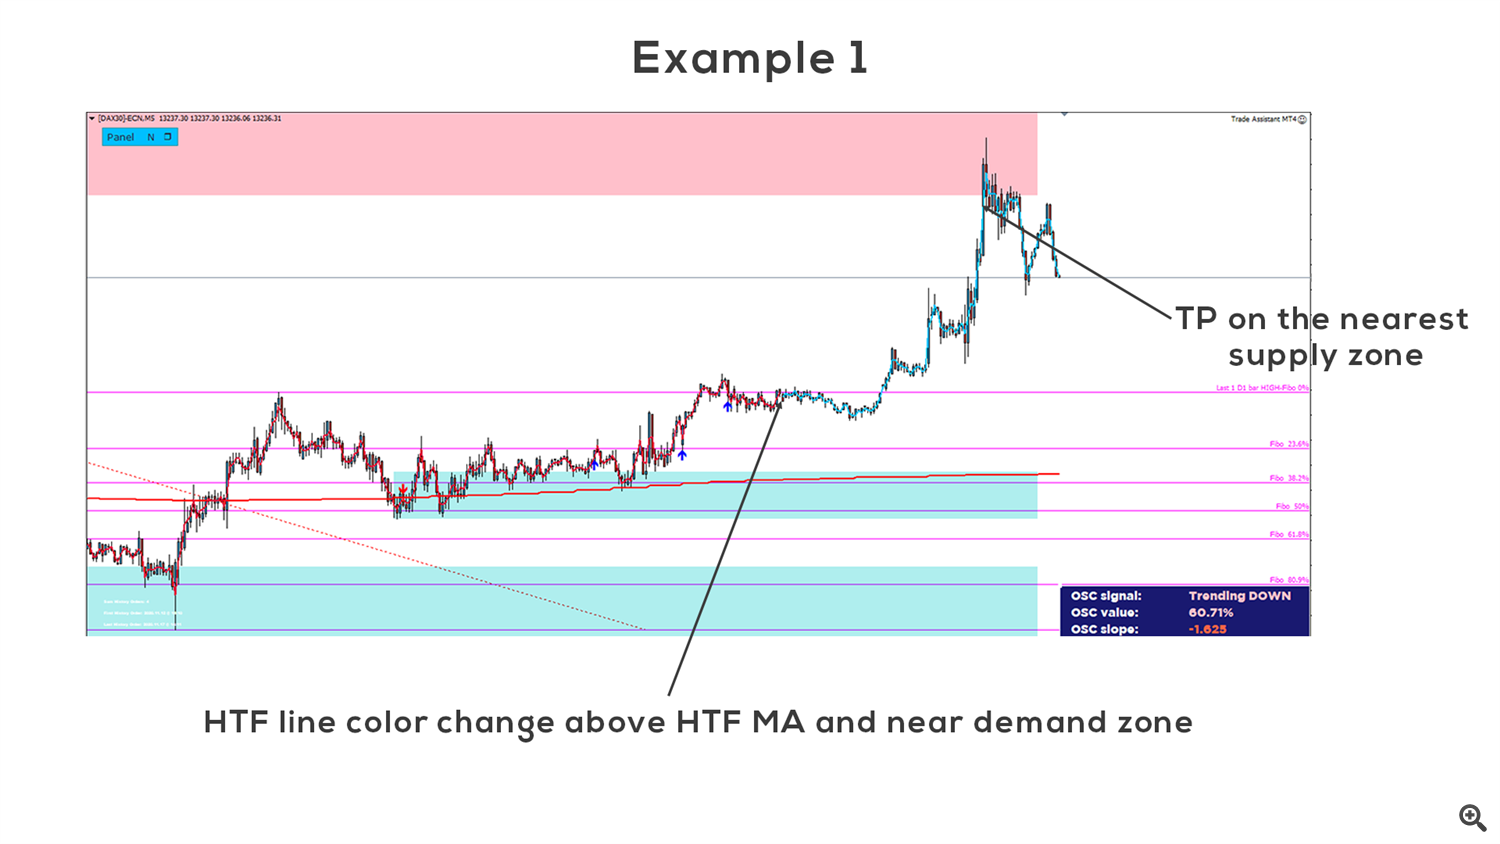
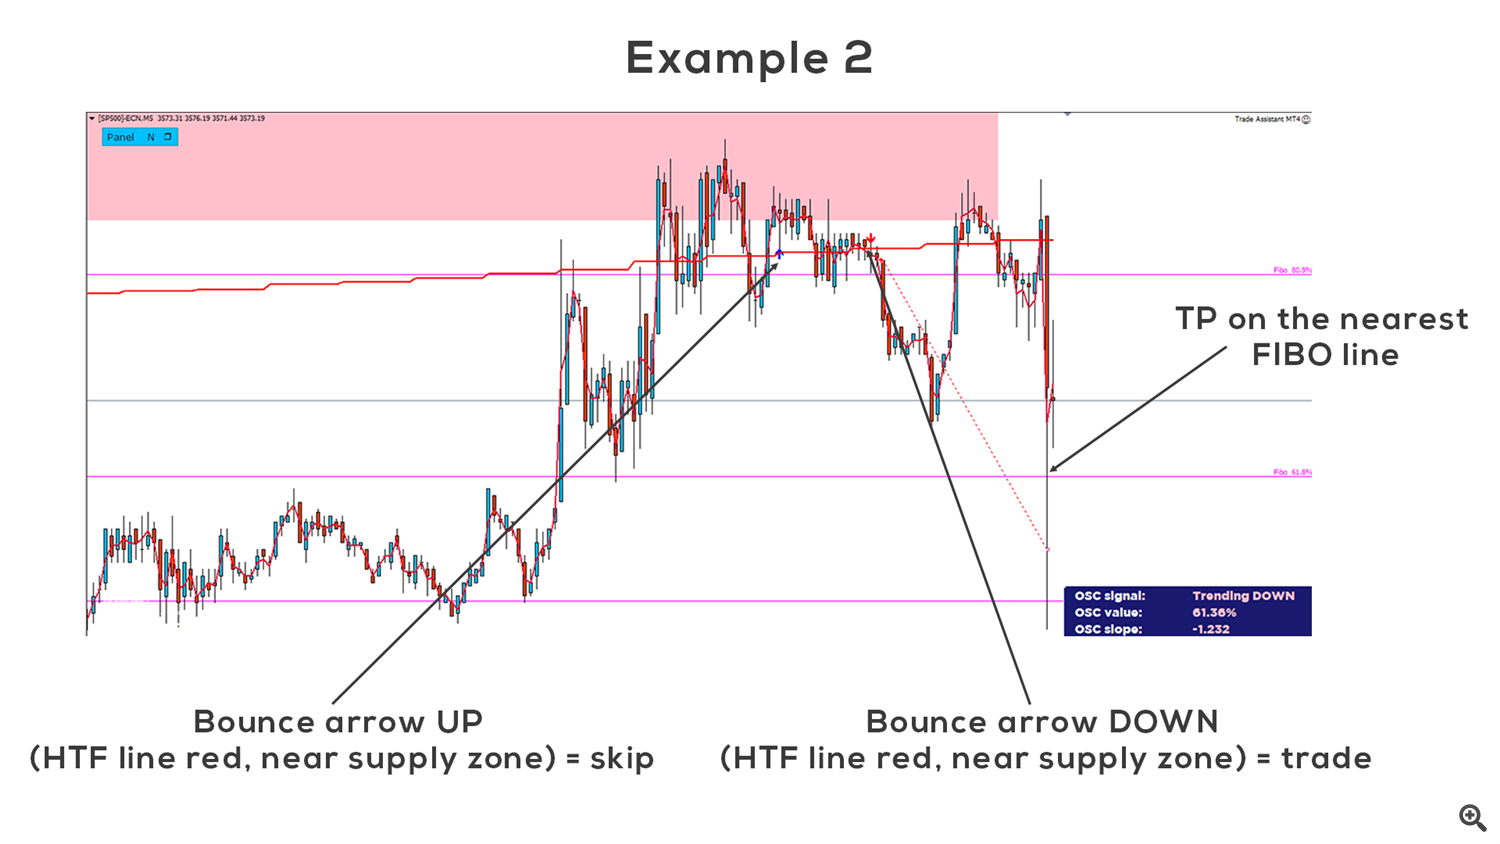
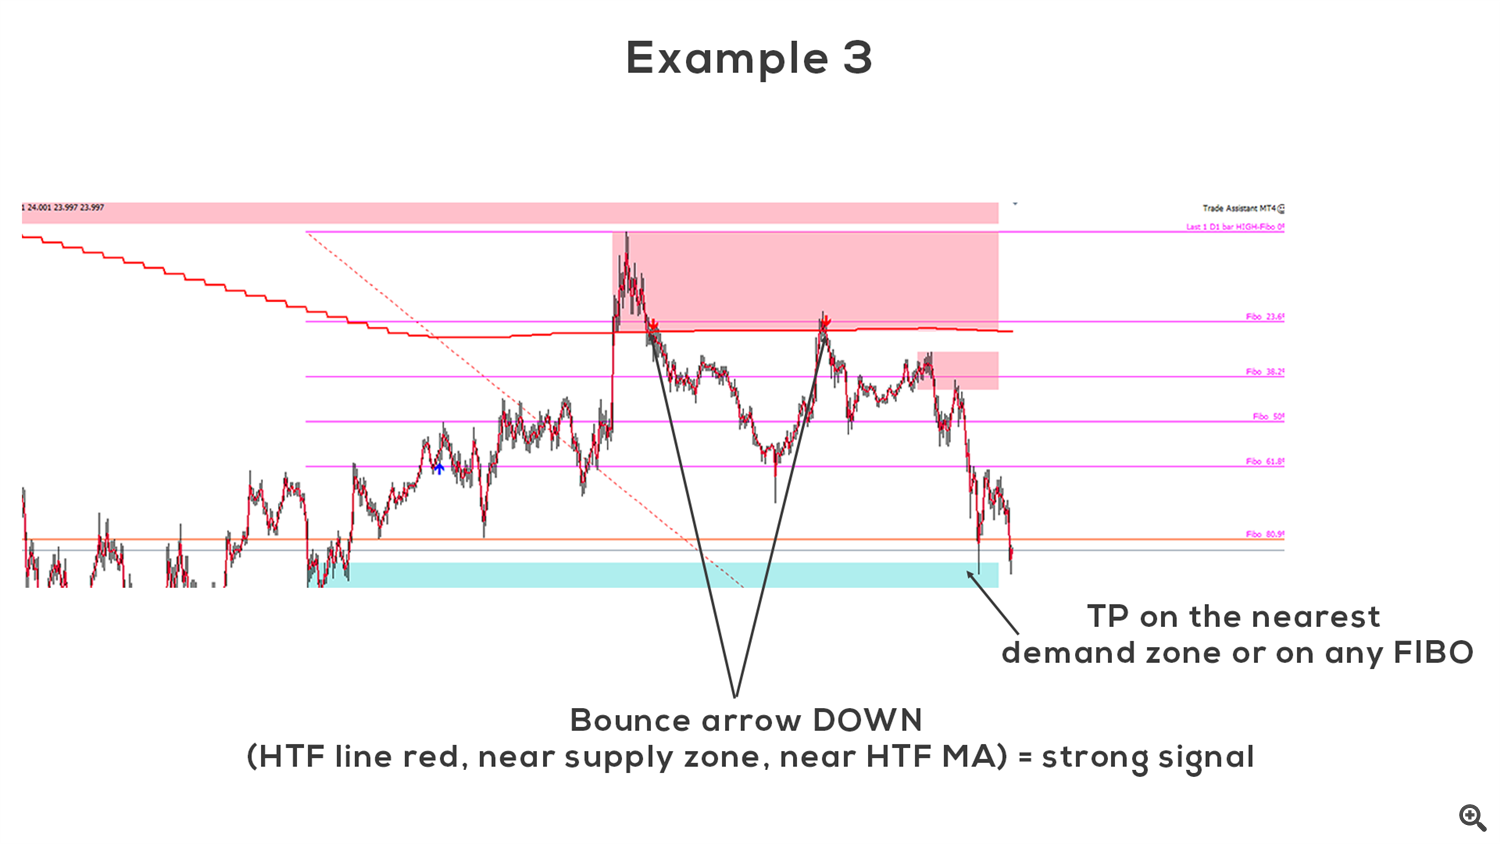
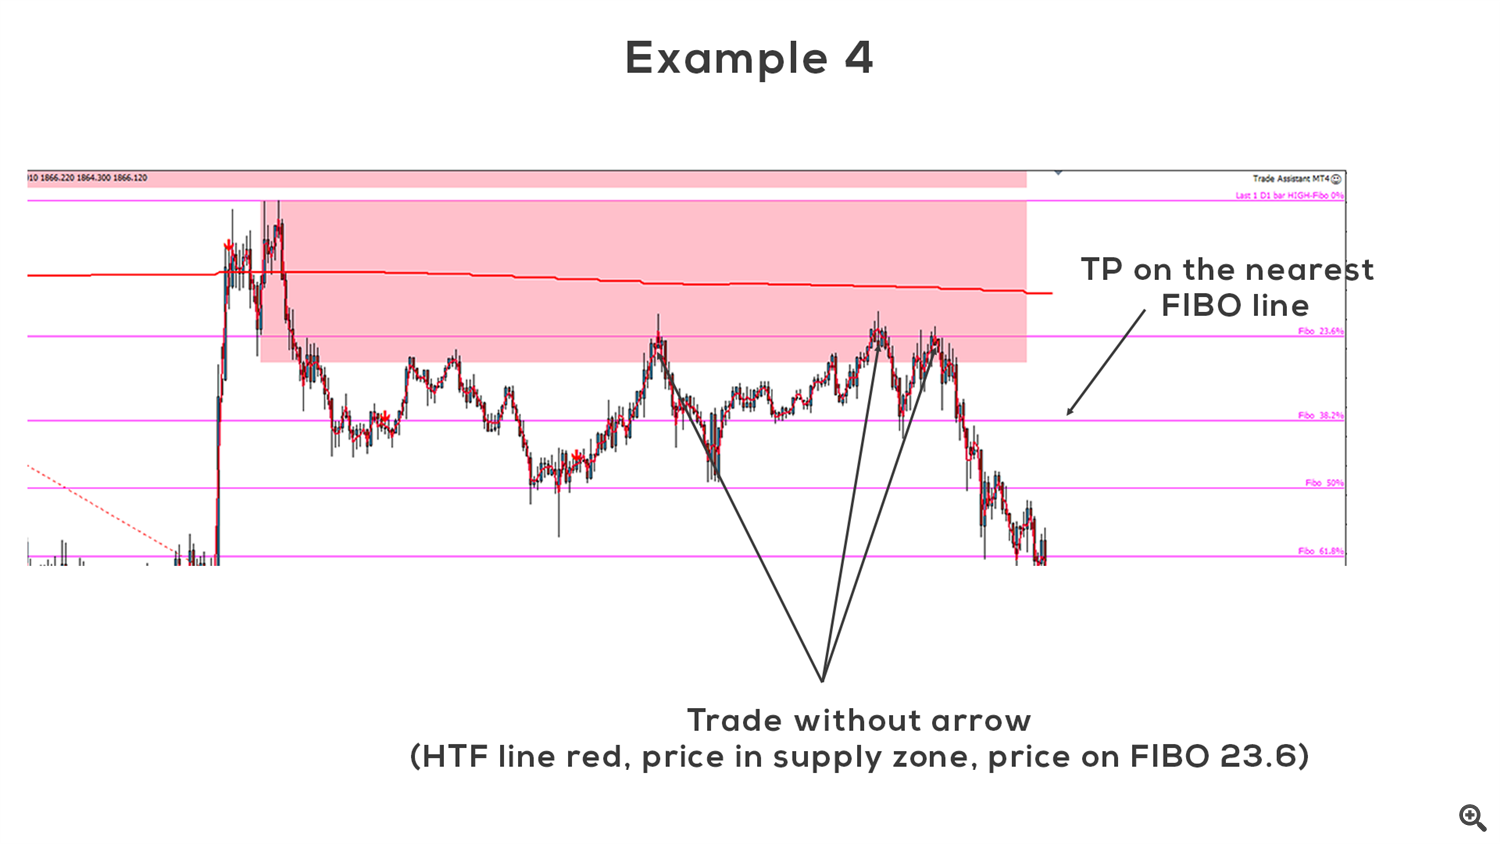
Good rule is to enter BUY when bounce arrow UP appears near demand zone, or enter SELL when bounce arrow DOWN appears near supply zone. When there is UP arrow near supply zone, you should skip this trade. Similar rule applies for DOWN arrow and demand zone. Supply & demand zones can be used for placing SL and TP as well.
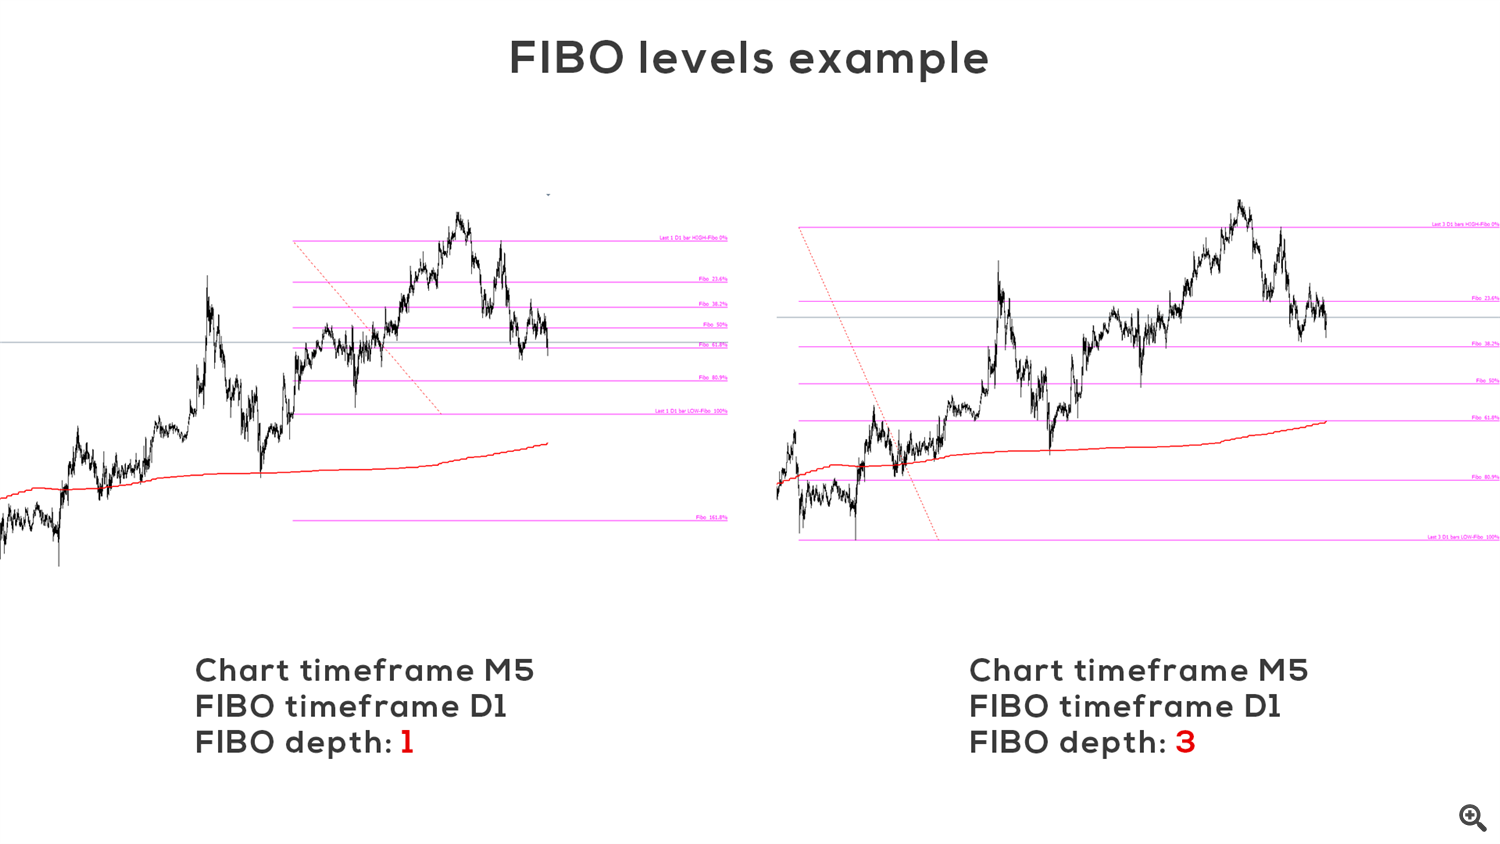
Second tool is automatic FIBO levels indicator. FIBO levels are great tool for placing SL and TP. User can enter custom FIBO levels, select timeframe for FIBO calculation, FIBO depth (number of bars used for calculation) and color of FIBO levels.
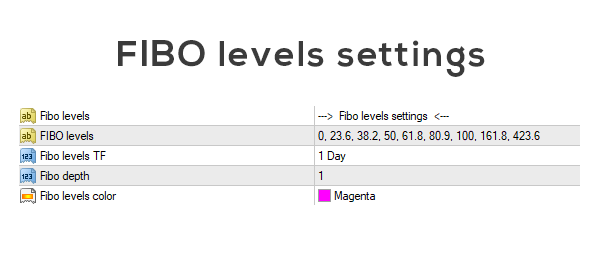
FIBO levels are calculated from previous closed bar. For example, if you select D1 timeframe and FIBO depth set to 5, FIBO levels will be calculated from previous 5 days.
Last tool that can be used fol filtering is oscillator signal HUD. This tool is using combination of 3 oscillators with different settings. Based on user settings it will give information about current chart situation.
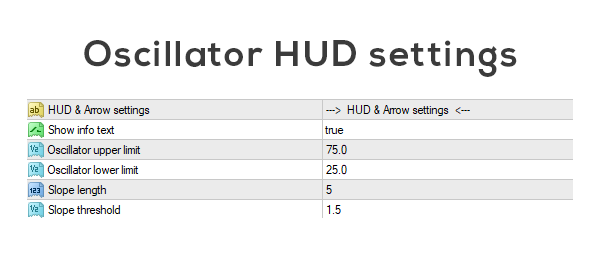
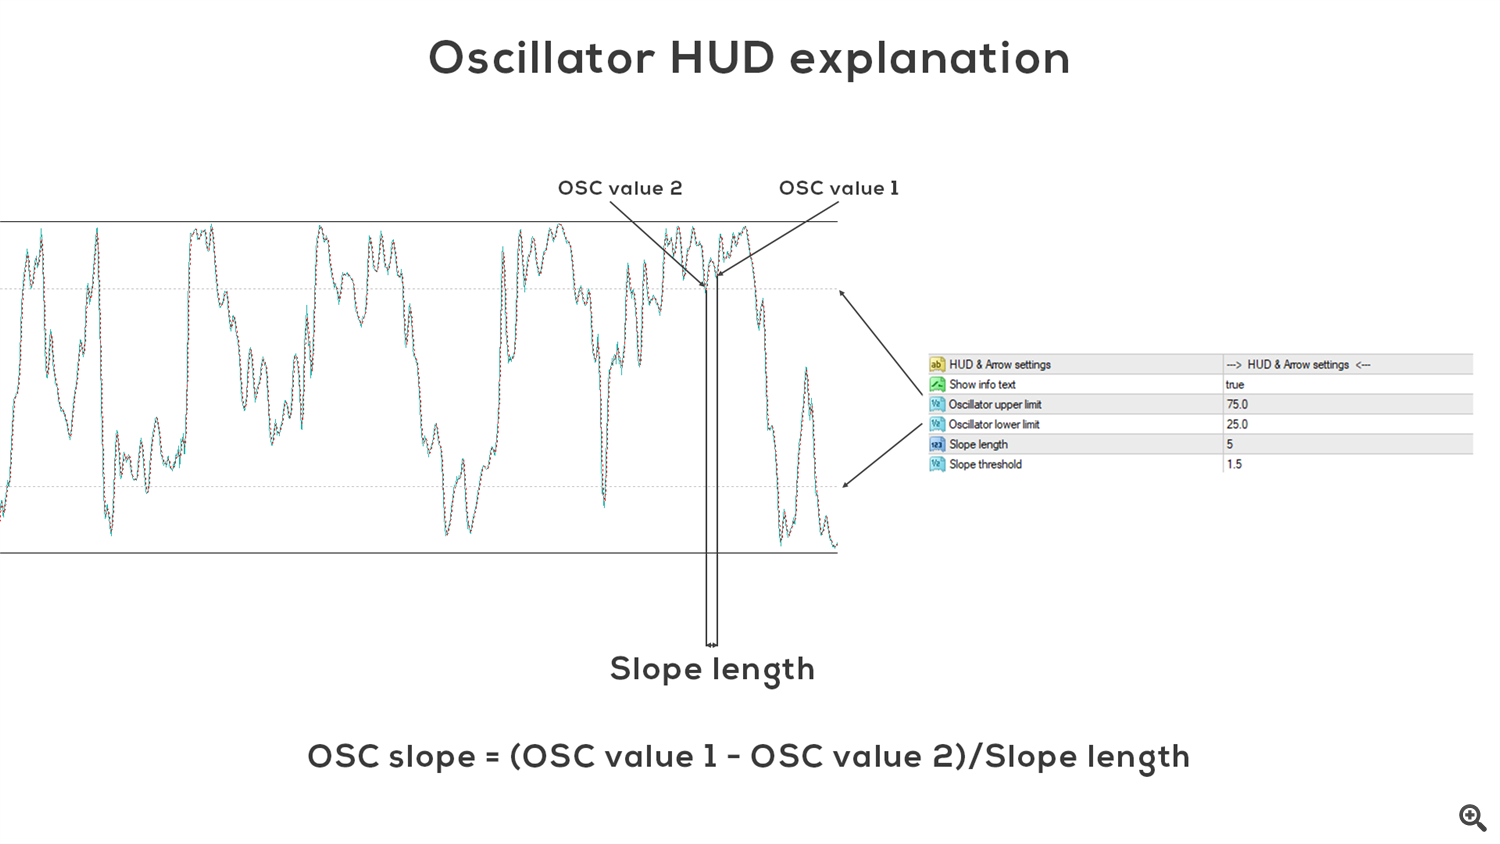
I will explain settings of this tool on stochastic oscillator. Oscillator upper and lower limits are basically limits for overbought and oversold areas. Depending on oscillator value and oscillator slope, oscilator HUD can give 7 differents outputs:
Strong SELL - oscillator value above upper limit, oscilator slope is negative and absolute value of slope >= slope threshold
Strong BUY - oscillator value below lower limit, oscilator slope is positive and absolute value of slope >= slope threshold
Weak SELL - oscillator value above upper limit, absolute value of slope < slope threshold
Weak BUY - oscillator value below lower limit, absolute value of slope < slope threshold
Trending DOWN - oscillator value between upper and lower limit, oscilator slope is negative
Trending UP - oscillator value between upper and lower limit , oscilator slope is positive
No clear Direction - other combinations
Trading examples
iCustom implementation
int start()
{
double ArrowUP = get_MAB(0);
double ArrowDOWN = get_MAB(1);
double HTFma = get_MAB(5);
double HTFlineUP = get_MAB(6);
double HTFlineDOWN = get_MAB(7);
//if(ArrowUP != 0) .... BUY...
return(0);
}
double get_MAB(int buff)
{
double mab_val = iCustom(Symbol(), PERIOD_CURRENT, "\\MA Bounce",
"---",
1, //Alert method 0 - Proximity sensor, 1 - Bounce indicator
20, //Current MA period
MODE_SMA, //Current MA type
PRICE_CLOSE, //Current MA applied price
2.0, //MA proximity range in pips
"---",
false, //Show HTF MA
200, //HTF MA period
MODE_SMA, //MA type
PRICE_CLOSE, //MA applied price
PERIOD_H1, //Timeframe for HTF MA
"---",
true, //Show arrows
true, //Show HTF line
10, //Filter period
5000, //Bars limit
"---",
3, //SR zones method 0 - Supply & Demand, 1 - FIBO, 2 - Both, 3 - None
"---",
false, //Show weak zones
60, //Supply & demand zones TF
clrPink, //Supply color
clrPaleTurquoise, //Demand color
"---",
"0, 23.6, 38.2, 50, 61.8, 80.9, 100, 161.8, 423.6", //FIBO levels
1440, //Fibo levels TF
1, //Fibo depth
clrMagenta, //Fibo levels color
"---",
false, //Use alerts
false, //Use push notifications
false, //Use email notifications
"---",
true, //Show info text
80.0, //Oscillator upper limit
20.0, //Oscillator lower limit
5, //Slope length
1.5, //Slope threshold
233, //Arrow style UP
234, //Arrow style DOWN
buff,
1);
return (mab_val);
}

