

First of all, I tried unsuccessfully to upload this indicator into the Codebase. Not matter what I tried to re-code/optimize the code I was always getting the error "Tester takes too long time". After a dozen tries I gave up. Since there is not much information on this error - even the hyperlink error launches a page in which the error itself it is not even listed there, that is why I'm posting the indicator here in the Blog and on the Indicators Forum. Maybe someone who has the time to see what probably am doing wrong and give me an advice. In a local MT5 installation everything runs perfectly...
This is a very nice indicator dating back from 2006, created by trader Dean Malone of CompassFX. The purpose here is to present to the new traders a safe way to start studying the market and for those already traders who didn't know this methodology to give it a try. Please refer to an old thread from MQL5 Forum that has several information about this methodology (https://www.mql5.com/en/forum/177803). The methodology itself was opened to the public through several webinars all over the world, the instruments used on the indicators are very elemental, i.e. Moving Averages, Bollinger Bands, RSI... but the way Dean Malone groups and used all this information is genius
There are dozens of variations all over the world of this methodology, ranging from the most conservative to the most radical (scalping), so I strongly recommend you to search for the proper knowledge and training on this methodology, because at first sight, even if you drop both indicators on your chart, you will not have a clue how to operate them or why the hell the indicators are lighting up that candle! The goal here is to put this on open code and let everyone tweak it to their best being, adding your own vision and maybe mixing methodologies as a new instrument for you to experiment.
That said, let's go to the indicators...
INSTALLATION
There are 2 components: The Chart indicator and the Sub Window indicator. If you are downloading the .MQ5 files, compile both first (in the \INDICATORS folder), before adding them to your chart. The Chart Indicator NEEDS/READS the Sub Window indicator data. You CANNOT use just use ONE of them. You have to have BOTH indicators compiled in your MT5 system. AND, lastly, add first the Sub Window Indicator into your chart, and then the Chart Indicator.
BASICS
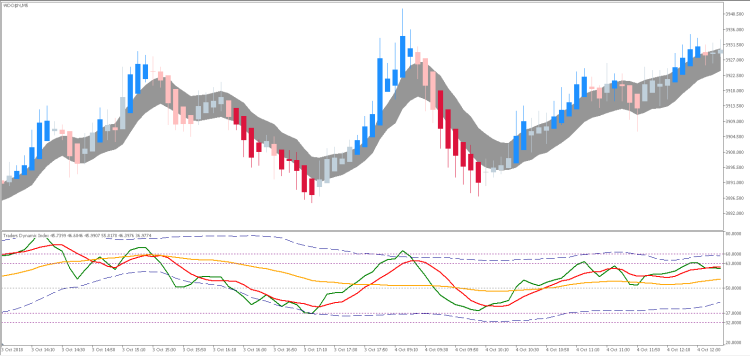
The Chart Indicator is composed of Heikin-Ashi candles plus a so-called Price Action Channel which in the original version of the methodology was composed as a 2-line channel. Since the rule is to NOT trade when candles are inside this channel, we changed this into a "cloud" to be more visual to the user. This Chart Indicator also reads all the rest of information from the Sub Window indicator in order to paint the Heikin-Ashi candles according to the rules of the/your methodology, so Light colors mean "do nothing" and STRONG Red and Blue colors mean "Trade!".
The Sub Window Indicator has all the important back-end information about the market, its direction, momentum and strength.
Originally this indicator was created to operate Futures and Stocks. In the case of Forex, you should play with the Parameter "Number of Digits", found in the CHART INDICATOR.
TWEAKING
We prepared the source code to be easily tweaked by any coder, so you can add your own rules and filters for "lighting up" the Heikin-Ashi candles according to your needs and the market you are operating. Basically, on the Chart Indicator you will find the 2 sections that are important - the BUY and SELL sections - where you can put your own code, using the buffers the indicator already have:
BUY SIGNAL DETECTOR
// BUY SIGNAL //////////////////////////////////////////////////////////////////////////////////////////////
if (buffer_C[i]>buffer_O[i] && buffer_C[i]>bufferPAHigh[i] &&  // Candle closing above the Price Action Channel
    buffer_C[i-1]>buffer_O[i-1] &&                             // Previous candle was also a Bullish one
    bufferPriceLine[i] > 50 &&                                 // Price Line above 50
    bufferPriceLine[i] > bufferSignalLine[i] &&                // Price Line above Signal Line
    bufferPriceLine[i] > bufferMktBaseline[i]                  // Price Line above the Market Sentiment (baseline)
    )  {
    bufferColor[i]     = 2;  // Strong Blue color
    bufferBuyPrice[i]  = SymbolInfoDouble( _Symbol, SYMBOL_ASK);  // market price...
    bufferSellPrice[i] = EMPTY_VALUE;
} else {
    bufferBuyPrice[i] = EMPTY_VALUE;
}
SELL SIGNAL DETECTOR
// SELL SIGNAL //////////////////////////////////////////////////////////////////////////////////////////////
if (buffer_C[i]<buffer_O[i] && buffer_C[i]<bufferPALow[i] &&   // Candle closing below the Price Action Channel
    buffer_C[i-1]<buffer_O[i-1] &&                             // Previous candle was also a Bearish one
    bufferPriceLine[i] < 50 &&                                 // Price Line below 50
    bufferPriceLine[i] < bufferSignalLine[i] &&                // Price Line below Signal Line
    bufferPriceLine[i] < bufferMktBaseline[i]                  // Price Line below the Market Sentiment (baseline)
    )  {
    bufferColor[i]     = 3;   // Strong Red color
    bufferSellPrice[i] = SymbolInfoDouble( _Symbol, SYMBOL_BID);  // market price...
    bufferBuyPrice[i]  = EMPTY_VALUE;

} else {
    bufferSellPrice[i] = EMPTY_VALUE;
}
Again, before you use this methodology you need to understand it. Watch & learn about it, maybe this is your path to success (or, more success!).
EXPERT ADVISOR?
As always, if you have a pluggable EA or via iCustom() you want to use this indicator as a source for BUY/SELL signals, there are 2 buffers (0 and 1) which corresponds to the BUY and SELL signals that an EA could use to enter a trade...
Live Long and Prosper.


