

US stock markets on Tuesday continue to grow after positive US economic data on Monday led to the growth of US indices to record highs.
The ISM business activity index in the US manufacturing sector for September was 60.8 (the forecast was 58.0, the previous value was 58.8). Thus, activity in the US manufacturing sector in September reached a 13-year high, surpassing the expectations of economists.
The construction costs index in the US in August was 0.5% (the forecast was 0.4%, the previous value -1.2%). The index of gradual acceleration of inflation from ISM for September was 71.5 (the forecast was 64.0, the previous value of 62.0).
Another portion of strong macro data showed that the US economy is currently demonstrating a stable state and growth.
Investors are betting on strengthening economic growth and tightening monetary policy in the United States. President of the Federal Reserve Bank of Dallas Robert Kaplan on Monday did not exclude the possibility of raising the interest rates of the Fed this year. "We need to think about taking measures in December", Kaplan said.
The yield of 10-year US Treasury bonds today rose to 2.347% from the level of 2,337%, recorded on Monday. The index of the dollar WSJ rose by 0.2% after reaching a maximum from the end of July to 87.00. The increase in the dollar is also accompanied by an increase in the yield of US government bonds. Investors continue to withdraw funds from assets-shelters, such as franc, yen, gold, and actively "invested" in the assets of the American stock market, contributing to the further growth of stock indices.
*)An advanced fundamental analysis is available on the Tifia Forex Broker website at tifia.com/analytics
Support and resistance levels
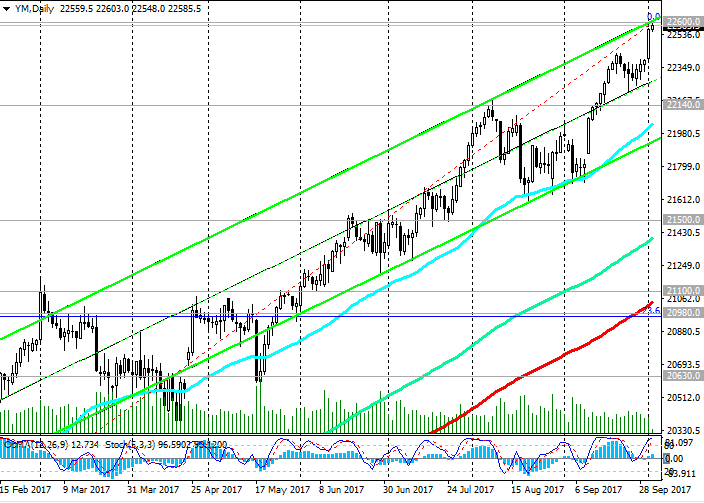
The DJIA index continues to grow in the uplink on the daily chart and is traded today at the upper border of this channel near the 22600.0 mark, the absolute and annual maximum.
Reducing geopolitical risks, fears about the consequences of hurricanes in the US, as well as a portion of positive macro data from the US, which increase the likelihood of an increase in the interest rate in December, contributes to an increase in investors' appetite for the purchase of risky assets.
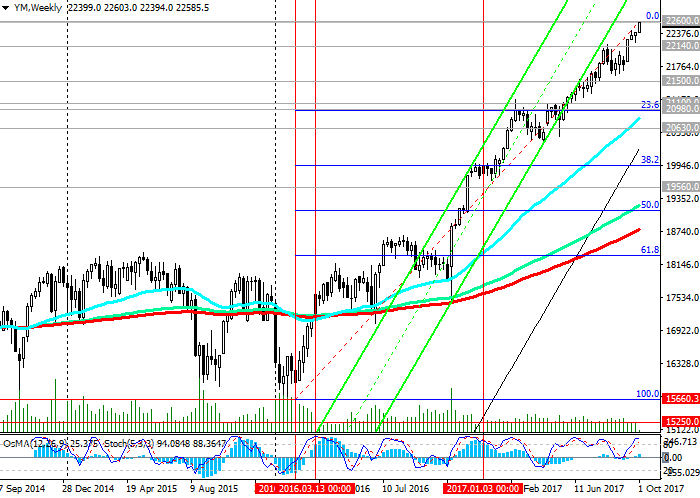
Technical indicators (OsMA and Stochastics) recommend long positions on 4-hour, daily, weekly charts.
Return to consideration of short positions is possible only after the breakthrough of the important support level 22140.0 (EMA200 on the 4-hour chart).
The target of the decrease may be support levels of 21500.0, 21100.0 (EMA200 on the daily chart), 20980.0 (Fibonacci level of 23.6% correction to the wave growth from the level of 15660.0 after recovery in February of this year to the collapse of the markets since the beginning of the year. the Fibonacci level of 0% is near the mark of 22177.0).
DJIA maintains positive long-term dynamics. Breakdown of the local resistance level 22600.0 will signal the continuation of the growth of the index.
Support levels: 22140.0, 22000.0, 21500.0, 21100.0, 20980.0, 20630.0
Resistance levels: 22600.0
Trading Scenarios
Buy in the market. Stop-Loss 22400.0. Take-Profit 22650.0, 23000.0, 24000.0
Sell Stop 22400.0. Stop-Loss 22620.0. Take-Profit 22140.0, 22000.0, 21500.0, 21100.0, 20980.0, 20630.0
*) For up-to-date and detailed analytics and news on the forex market visit Tifia Forex Broker website tifia.com


")
 & AMD Framework")