NZD/USD: unemployment in New Zealand remains relatively low

Today at 21:45 (GMT) will be published data from the labor market of New Zealand. It is expected that unemployment in New Zealand declined in the second quarter by 0.1% to 4.8%.
At levels below 5% unemployment in the country was in the period from 2003 to 2008. Nevertheless, unemployment of 4.9% is a significant improvement compared to the peak of 6.7% achieved after the financial crisis. The decrease in the unemployment rate and the increase in the labor force share in the total population (70.7% in the second quarter versus 70.6% in the first quarter) indicate a decrease in available resources in the labor market, which may finally lead to an increase in the level of salaries in the country, Stimulating domestic demand and GDP growth. If the data is confirmed, this will have a positive effect on the New Zealand currency.
Also worth paying attention to the publication at 14:00 (GMT) of the price index for dairy products. The milk auction that was held two weeks ago indicated another growth in world prices for dairy products. The price index for dairy products, prepared by Global Dairy Trade, came out with a value of + 0.2%. The main export item of the country is dry milk. The next increase in prices will support the New Zealand currency. The New Zealand dollar in the NZD / USD pair also receives support from the declining US currency and positive data coming from China. China is the largest trade and economic partner of New Zealand and a buyer of its primary commodities, including dairy products. Strong macroeconomic indicators from China have a positive effect on the quotations of the New Zealand currency.
Today, investors will also monitor the publication during the period 12:30 - 14:00 (GMT) of the important US inflation figures for June (personal income and personal consumption expenditure), as well as the ISM business activity index in the manufacturing sector of the US economy, which is an important An indicator of the state of the American economy as a whole. The result above 50 is considered positive and strengthens the USD, below 50 - as negative for the US dollar. Forecast: 56.5 in July (against 57.8 in June). If the indices come out with better indicators than the forecast, the US dollar will strengthen on the foreign exchange market.
*)An advanced fundamental analysis is available on the Tifia website at tifia.com/analytics
Support and resistance levels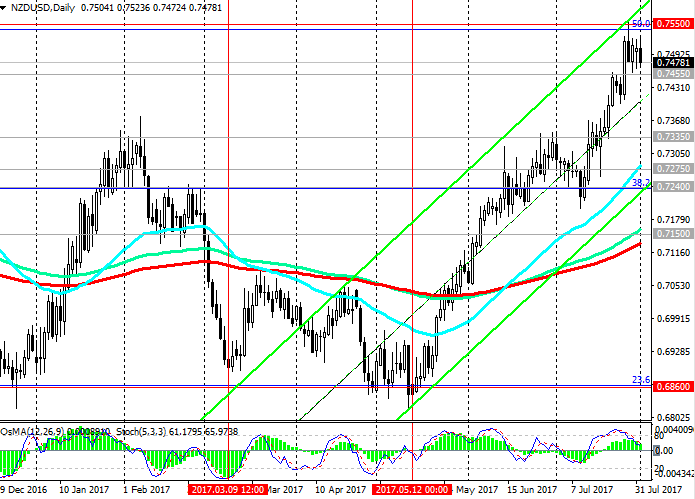
As a result of the three-month rally, the NZD / USD pair reached a new annual maximum and a resistance level of 0.7550 last week (Fibonacci level of 38.2% of the upward correction to the global wave of decline of the pair from the level of 0.8800, which began in July 2014, the low of December 2016). The pair NZD / USD very technically rebounded in mid-May from the support level of 0.6860 (Fibonacci level of 23.6%). So what next?
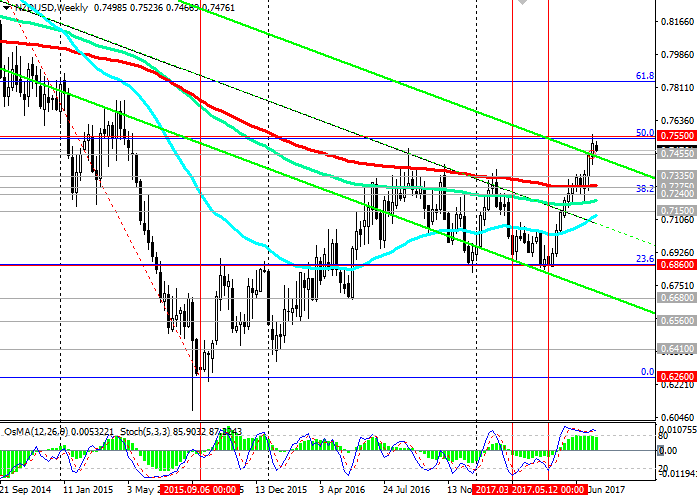
The NZD / USD pair is in a global downtrend since July 2014. A break of 0.7550 would mean the end of the global bearish trend. Nevertheless, the current growth of the NZD / USD pair is largely due to the general weakening of the US dollar.
Back in June, when the Reserve Bank of New Zealand kept interest rates unchanged at 1.75%, RBNZ Governor Graham Wheeler noted that "monetary policy will remain soft for a significant period". Now investors assess the prospects for the divergence of the directions of the monetary policy of the Fed and the RBNZ. If the Fed still confirms the intention to raise the rate in December, and the US will begin to receive positive macroeconomic data and the internal political crisis subsides, the US dollar will quickly regain its lost positions.
Despite the fact that the indicators OsMA and Stochastics on the weekly and monthly charts recommend long positions, on the daily, 4-hour charts, the indicators moved to the side of sellers, signaling an overdue downward correction.
While the NZD / USD pair is above the key support levels of 0.7275 (EMA200 on the weekly chart), 0.7240 (the Fibonacci level of 38.2%), its positive dynamics persists. In case of a breakdown at the level of 0.7240, the NZD / USD pair will accelerate its decline to the support level of 0.7150 (EMA200 on the daily chart). The more distant target of the decline is the support level of 0.6860 (Fibonacci level of 23.6% and the lower limit of the range located between the levels of 0.7550 and 0.6860). At the level of 0.6860 are also the minimums of December 2016 and May 2017.
Support levels: 0.7455, 0.7335, 0.7275, 0.7240, 0.7150, 0.7100
Resistance levels: 0.7550
Trading Scenarios
Sell Stop 0.7450. Stop-Loss 0.7520. Take-Profit 0.7335, 0.7275, 0.7240, 0.7150, 0.7100
Buy Stop 0.7520. Stop-Loss 0.7450. Take-Profit 0.7550, 0.7600
*) For up-to-date and detailed analytics and news on the forex market visit Tifia company website tifia.com


 Trading Guide")
