American stock indexes retain a positive trend against the backdrop of sales of government bonds. The yield of 10-year US government bonds, according to Tradeweb, rose on Wednesday to 2.223% from 2.198% on Tuesday. Investors remain confident that US economic growth is strong enough. At the same time, there were also speculations that weak inflation in the US would force the Fed to refrain from raising interest rates.
The index of Nasdaq Composite on Wednesday showed the most significant growth since November and increased by 87.79 points (by 1.4%) to 6234.41 points. Growth in the price of shares of technology and financial companies contribute to the growth of US stock indices. Shares in the technology sector in the S & P500 this year increased by almost 19%, and on Wednesday again showed the leading dynamics, rising by 1.3%. The financial sector in the S & P500 grew by 1.6% yesterday. The index itself S & P500 gained 0.9%, rising above the mark of 2440.0.
Newly rising oil prices also contribute to the growth of oil and gas stocks in the S & P500 index. Despite the release of data that recorded an increase in US oil inventories in the last week, Brent crude futures rose 0.9% to $ 47.95 per barrel.
If Donald Trump can keep his promise and reduce corporate taxes, this will further promote the growth of US indices.
Thus, there is every reason to assume that the positive dynamics of US stock indices will continue, probably even before the end of the year, when the Fed again can raise the interest rate.
*)An advanced fundamental analysis is available on the Tifia website at tifia.com/analytics

Technical analysis
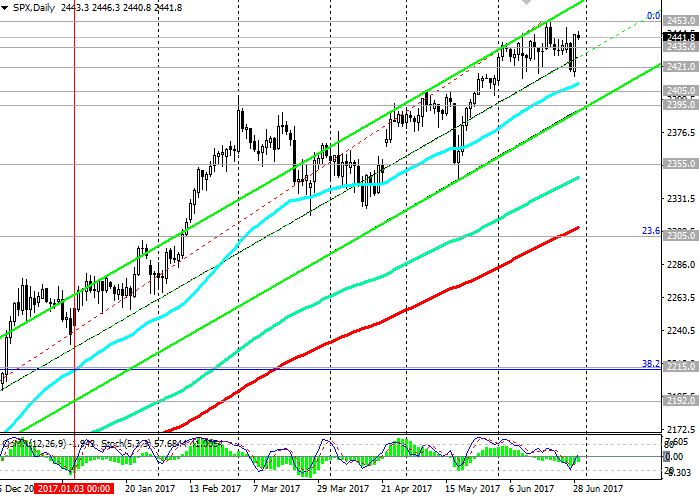
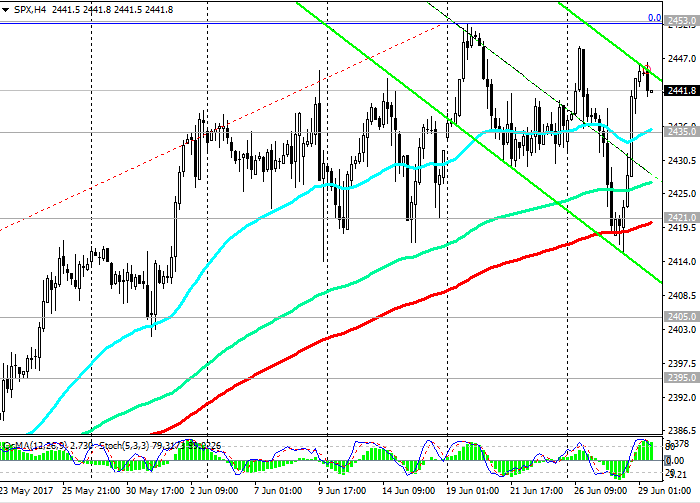
The index continues to grow in the ascending channels on the daily, weekly charts. At the beginning of today's European session, the index trades above the short-term support level of 2435.0 (EMA50 on the 4-hour chart, EMA200 on the 1-hour chart). In June, the index updated the absolute maximum near the mark of 2453.0.
Nevertheless, the OsMA and Stochastic indicators on the 1-hour and 4-hour charts turned to short positions. A downward correction is likely with the immediate goals of 2435.0, 2421.0 (EMA200 on the 4-hour chart). Only the breakdown of the support level at 2395.0 (the lower limit of the uplink on the daily chart and the highs of February and April) can cause a deeper correction to the level of 2355.0 (May lows). The breakdown of the support level of 2305.0 (EMA200 on the daily chart and the Fibonacci level of 23.6% of the correction for growth since February 2016) will cancel the bullish trend of the index.
Nevertheless, the positive dynamics of the S & P500 index remains. After the breakdown of the resistance level of 2453.0 (June highs), the growth of the index will resume.
Support levels: 2435.0, 2421.0, 2405.0, 2395.0, 2355.0, 2305.0
Resistance levels: 2453.0

Trading Scenarios
Sell Stop 2405.0. Stop-Loss 2417.0. Objectives 2388.0, 2355.0, 2326.0, 2305.0, 2280.0
Buy Stop 2417.0. Stop-Loss 2405.0. Objectives 2450.0, 2500.00
*) For up-to-date and detailed analytics and news on the forex market visit Tifia company website tifia.com


