

Despite all the volatility of foreign exchange markets and the uncertainty in the world political arena observed in recent weeks, the US stock market remains stable, as evidenced by the continued growth of major US stock indexes.
While the index of the dollar WSJ, which reflects the value of the US dollar against 16 other currencies, declined in recent months to a level near the level of 88.00 (on Tuesday the index closed at a minimum since November 4), and the yield of 10-year US government bonds fell to the level of 2.1 % -2.2%, US stock indexes are breaking new records. So, the S & P500 index rose by 1.2% in May. DJIA and S & P500 rose for the second month in a row. But the biggest increase is demonstrated by the technological index Nasdaq, which in May grew by 2.5%, and the Nasdaq index has been growing for the seventh month in a row.
The Dow Jones Industrial Average, which includes shares of the largest US banks, also demonstrates a stable upward trend, which began in February last year.
Even after the publication of an ambiguous report on the US labor market, published last Friday, the main US stock indexes rose again. The unemployment rate reached a minimum in May for 16 years, down to 4.3% from 4.4% in April. In general, the report on the US labor market is favorable enough for the Fed to raise interest rates next week. The probability of this is estimated by investors at about 90%.
"Given the good state of the economy", as President of the Federal Reserve Bank of Philadelphia Patrick Harker said last week, we can expect further growth in US stock indices, even though the Fed will raise the interest rate.
Uncertainty about the implementation of the new economic policy of US President Donald Trump seems to be less worrisome for investors who are betting on the growth of the US stock market.
Today and tomorrow, a volatility surge is expected in the foreign exchange market due to the fact that
the ECB decides on the interest rate, there will be elections in the UK, and in the US, a former FBI head James Komi will speak in a Senate committee, testifying to the possible impact of Russia on the election campaign in the US, which can further complicate the position of President Donald Trump . The most cautious traders today took a wait-and-see attitude.
With respect to the US stock indices, we can say that strong corporate reports for the first quarter, evidence of a stable recovery in the US economy, and a policy of gradual increase in interest rates in the US create the basis for further growth of the US stock market.
Support and resistance levels
At the beginning of the month the DJIA index exceeded the recent annual highs near 21170.0 and closed last week at the new absolute maximum of 21200.0.
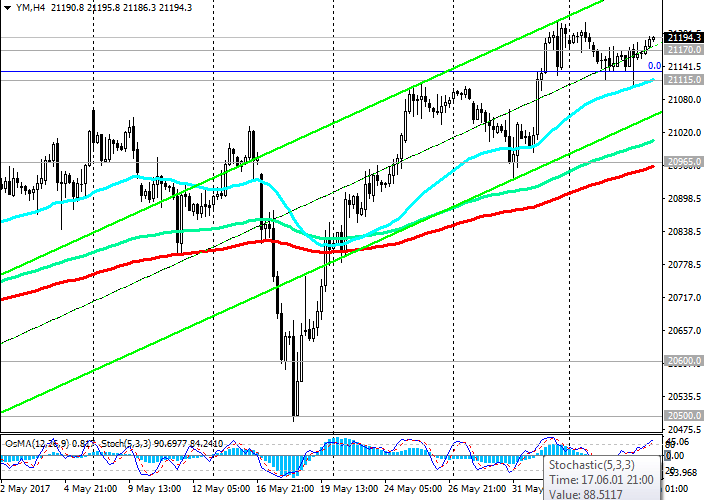
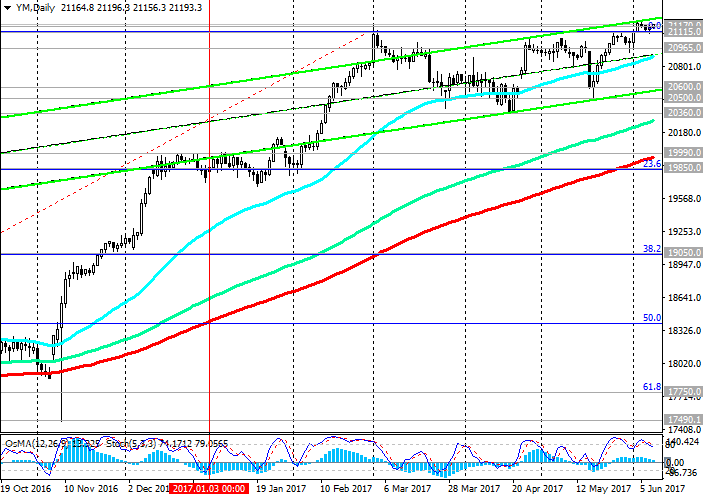
Indicators OsMA and Stochastics on the 4-hour, daily, weekly charts continue to remain on the side of buyers. The DJIA index continues to grow in the ascending channels on the 4-hour, daily, weekly charts. In case of breakdown of the level 21200.0, the growth of the index may continue.
In the alternative scenario, a short-term correction to the lower border of the uplink and EMA200 on the 1-hour chart (level 21115.0) is possible. Deeper correction movement is possible to the lower border of the ascending channel on the daily chart (level 20600.0).
If the downward trend is to increase, then the decline in the index may extend to support levels of 20360.0 (April lows), 19990.0 (EMA200 on the daily chart and December highs), 19850.0 (Fibonacci level of 23.6% correction to the wave growth from the level of 15660.0 after recovery in February this year to the collapse of the markets since the beginning of the year. The maximum of this wave and the Fibonacci level of 0% are near the mark of 21170.0).
The positive dynamics of the US stock market and DJIA index remains. Only in case of breakdown of the support level 19850.0 can we speak about the breakdown of the bullish trend.
Support levels: 21170.0, 21020.0, 21000.0, 20965.0, 20825.0, 20600.0, 20500.0, 20360.0, 19990.0, 19850.0
Resistance levels: 21200.0, 22000.0
Trading Scenarios
Buy in the market. Stop-Loss 21090.0. Take-Profit 21220.0, 22000.0
Sell Stop 21090.0. Stop-Loss 21220.0. Take-Profit 21020.0, 21000.0, 20965.0, 20825.0, 20600.0
*) Actual and detailed analytics can be found on the Tifia website at tifia.com/analytics


