

While all the attention of investors is concentrated these days on Europe, the Australian dollar has received powerful support today from positive macro statistics and is actively growing in the foreign exchange market. The Australian dollar strengthens in the foreign exchange market, and the AUD / USD pair has been growing for the fourth consecutive session.
According to the data released today, Australia's GDP in the first quarter grew by 0.3% (the forecast was + 0.2%) against + 1.1% in the previous quarter and by 1.7% in annual terms (forecast was +1.5 %). The data turned out to be better than the forecast, which inspired market participants, who resumed purchases of the Australian currency, despite the fact that this is the slowest annual GDP growth rate since 2009.
The growth of the Australian economy continues for 26 years after the recession that ended in the early 1990s. Over the years, the country's economy has become one of the most sustainable in the world.
Nevertheless, slow growth rates of wages and incomes of the population of Australia, increased unemployment and low, according to the RBA, the growth rate of the country's GDP can not but alarm the monetary authorities and the Australian government.
As you know, yesterday, the RB of Australia left the key interest rate unchanged at 1.50%. As it was said in the accompanying statement, "the strengthening of the Australian dollar will complicate the adjustment of the economy", and "the preservation of rates unchanged corresponds to the goals in relation to GDP, inflation". As noted in the RBA, the conditions for doing business in the country have improved, the capacity utilization has increased, however, there are other risks for the country's economy that restrain the RBA from tightening monetary policy.
At the same time, the slowdown in China's economy, Australia's largest trade and economic partner, its high debt levels represent an external medium-term risk factor for economic growth in Australia.
On Thursday (01:30 GMT), the Australian Bureau of Statistics will publish data on the foreign trade balance of Australia for April. A decrease in the balance surplus is expected to reach 1.91 billion Australian dollars. First of all, it is necessary to pay attention to the export data, which is the most important component of the country's budget. Reduction of the balance and export level surplus may negatively affect the quotations of the Australian dollar.
Also on Thursday and Friday during the Asian trading session in China, published a number of important macroeconomic indicators (for May). If the data indicate deterioration in China's foreign trade balance and a slowdown in inflation, the Australian dollar may also react with a decline.
Support and resistance levels
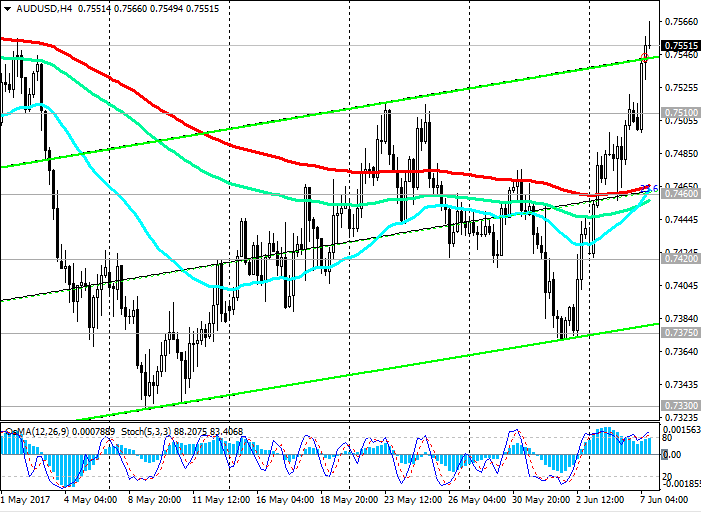
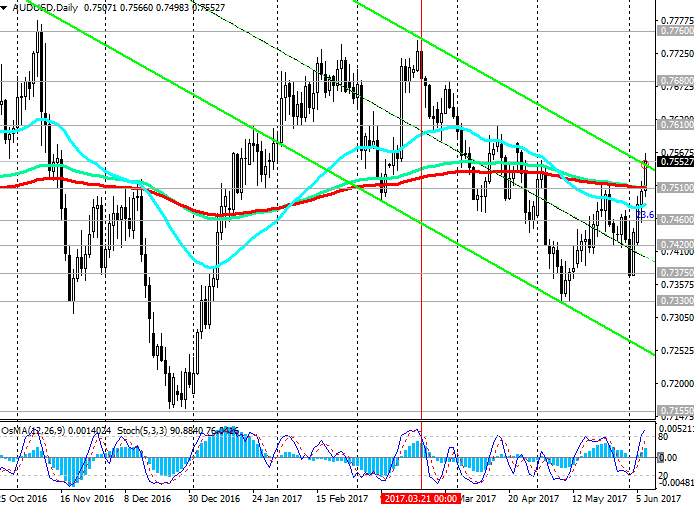
The AUD / USD pair broke the key resistance level 0.7510 (EMA200, EMA144 on the daily chart) at a strong positive momentum at the beginning of the month from the support level of 0.7375 (the bottom line of the uplink on the 4-hour chart and on the weekly chart) and develops an upward trend.
The pair AUD / USD is trading in the uplink on the weekly chart, the upper limit of which is above the resistance level of 0.7840 (the Fibonacci level of 38.2% correction to the wave of decline of the pair since July 2014).
Indicators OsMA and Stochastics on the 4-hour, daily and weekly charts went to the side of buyers.
The pair's growth will continue with the targets of 0.7610, 0.7680, 0.7760 (EMA144 on the weekly chart), 0.7840 (the Fibonacci level of 38.2% correction to the wave of the pair's decline since July 2014), provided the US dollar remains weak. A more distant medium-term goal in this case is the level of 0.8000 (EMA200 on the weekly chart). If the positive dynamics of the AUD / USD pair remains, this goal can be achieved by September-October of the current year.
The reverse scenario implies a return to the descending channel on the daily chart and the resumption of the decline in the wave that began in mid-March. The breakdown of the short-term support level at 0.7460 (EMA200 on 1-hour, 4-hour charts and 23.6% Fibonacci level) will confirm this scenario. The nearest medium-term goal in case of further decline in the pair will be the level of 0.7330 (November and May lows). The next target in case of breakdown of this support level is the level of 0.7155 (May, December minima of 2016). The minimum of wave in the last global decline of the pair since July 2014 is close to the level of 0.6830.
Support levels: 0.7510, 0.7460, 0.7420, 0.7375, 0.7330, 0.7300, 0.7200, 0.7155
Resistance levels: 0.7570, 0.7610, 0.7680, 0.7760
Trading Scenarios
Sell Stop 0.7490. Stop-Loss 0.7530. Take-Profit 0.7460, 0.7420, 0.7375, 0.7330, 0.7300, 0.7200, 0.7155
Buy Stop 0.7570. Stop-Loss 0.7530. Take-Profit 0.7600, 0.7680, 0.7760
*) Actual and detailed analytics can be found on the Tifia website at tifia.com/analytics


")
