
S&P500: US indices rise against the backdrop of rising commodity prices

The recovery of prices for oil and other commodities supports US stock indices. The increase in prices for iron ore and base metals supported the shares of companies in the mining sector. In the oil market, positive dynamics has also been prevailing over the last week. After last Wednesday the Ministry of Energy of the United States presented data that showed a significant drop in oil and petroleum products in the United States, oil prices have appreciated by 8.5% by today. At the same time, investors do not lose hope for an extension of the agreement on the reduction of oil production in the framework of OPEC. So, recently the Saudi oil Minister Khaled Al-Falikh and the Russian energy Minister Alexander Novak expressed support for the extension of the agreement on the reduction of production for another 9 months. The next OPEC meeting will be held on May 25.
As a result, against the background of positive expectations on the oil market, WTI futures for NYMEX closed on Monday with an increase of $ 1.01 (or 2.1%) at $ 48.85 per barrel. The sub-index of the oil and gas sector in the S&P500 grew by 0.6%, which gave a positive momentum to the entire S&P500 index. As a result of yesterday's trading day, the S&P500 grew by 0.5%, Nasdaq Composite - by 0.5%, Dow Jones Industrial Average - by 0.4%.
From the US continue to receive positive macroeconomic data. Despite some deviation from the forecasted values in the smaller direction, in general, the indicators of inflation and the labor market of the USA point to the growth of the economy in the country. As long as the economy is growing, investors will prefer stocks and other asset-safe havens and other risky instruments.
Nevertheless, investors still believe that the Fed will raise interest rates in June. According to CME Group, the probability of a rate hike next month is estimated at 74% (last week the probability was at 83%). The likelihood of an early increase in the interest rate is holding back from more active purchases on the US stock market, which, nevertheless, is dominated by a positive trend.
From the news for today we are waiting for the data from the USA. At 12:30 (GMT), a report on the dynamics of new permits for the construction of houses in the US for April, which is an important indicator of the housing market, will be presented. The higher the value, the more positive the effect is on the stock indices. Forecast: 1.27 million new permits (against 1.26 million permits last month). If the data prove to be better than the forecast, then the US indices will grow. At 13:15 (GMT) the report of the Board of Governors of the US Federal Reserve on the volume of industrial production and use of production capacities for April is published. A high result may indicate the existence of inflationary expectations and, consequently, a rapid rate increase, so a high figure strengthens the US dollar.
But at the same time, strong macro data contribute to the growth of investor confidence in the stability and growth of the US economy. And this is a positive fundamental factor for the US stock market. In general, the positive background for stock indices remains.
Support and resistance levels
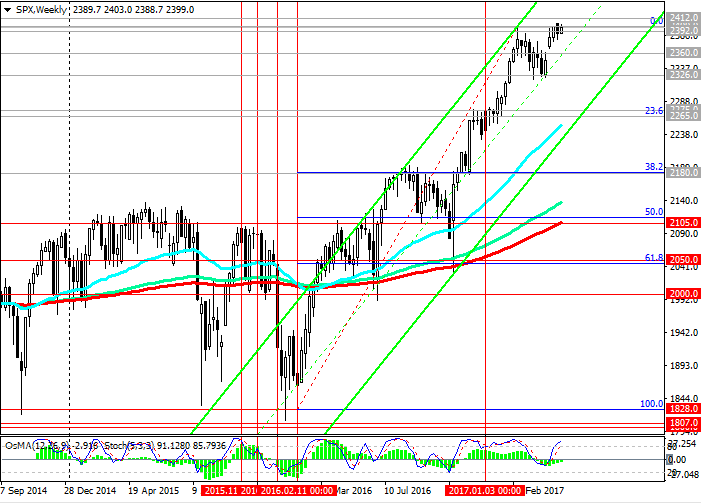
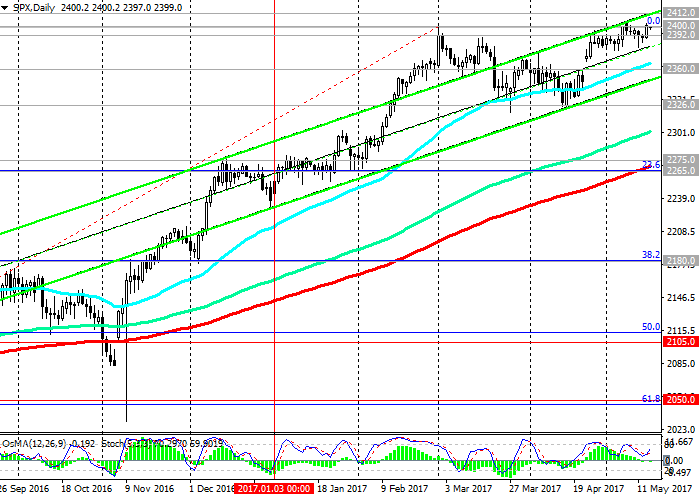
Since the opening of today's trading day, the S & P500 index has slightly decreased. Nevertheless, the positive dynamics of the S & P500 index remains. Since February 2016, the S & P500 index has been steadily growing and is in the ascending channels on the daily and weekly charts.
At the moment, the S & P500 again tests the resistance level of 2400.0, reached in early March, for breakdown.
Indicators OsMA and Stochastics on the daily, weekly, monthly charts went to the side of buyers. In case of resumption of growth, the nearest target will be level 2412.0 (the upper limit of the ascending channel on the daily chart).
The reverse scenario will be related to the breakdown of the short-term support level 2392.0 (EMA200 on the 1-hour chart) and the decrease with the nearest targets near the levels 2360.0 (the bottom line of the uplink on the daily chart), 2326.0 (April lows). The breakdown of support levels of 2275.0 (EMA200 on the daily chart), 2265.0 (Fibonacci level of 23.6% correction to growth since February 2016) will cancel the bullish trend of the index.
Support levels: 2392.0, 2375.0, 2360.0, 2326.0, 2275.0, 2265.0
Resistance levels: 2400.0, 2412.0
Trading Scenarios
Sell Stop 2390.0. Stop-Loss 2405.0. Objectives 2375.0, 2360.0, 2326.0, 2275.0, 2265.0
Buy Stop 2405.0. Stop-Loss 2390.0. Objectives 2412.0, 2420.0
*) Actual and detailed analytics can be found on the Tifia website at tifia.com/analytics


")
