US Treasury Secretary Stephen Mnuchin said in his yesterday's speech that the tax reform plan will appear "very, very soon". This plan will be "decisive, substantial and will be the main priority for President Trump." After the presidential elections in the US against the backdrop of Donald Trump's pre-election promises to carry out tax reforms and stimulate fiscal policy, American stock markets and indices were actively growing, and government bonds were subject to large-scale sales. Now the US stock markets are seeing the opposite picture.
Investors are still being pressured by increased geopolitical tensions in the world after US missile strikes against Syria. The growing tensions between the US and North Korea also do not contribute to an increase in appetite for the purchase of risky assets. Investors once again prefer government bonds and other assets-seekers - gold and yen.
Also the general picture spoils some negative macro data coming from the USA. So, the data released yesterday by the US Department of Labor showed a reduction in the number of repeated applications for unemployment benefits last week and an increase in the number of initial applications (244,000 versus 234,000 last week). The index of production activity, which is interrelated with the ISM index, fell to 22 points in April (against 32.8 in March).
Nevertheless, the main US stock indexes have grown today thanks to reports of companies exceeding the expectations of economists. Dow Jones Industrial Average rose on Thursday by 0.9% to 20582 points, S & P500 - by 0.8%, Nasdaq Composite - by 0.9%. The yield of 10-year US Treasury bonds against their sales rose to 2.257% from 2.202% on Wednesday, which also helped strengthen the dollar. US Treasury Secretary Stephen Mnuchin cheered up investors, giving them hope that Trump's plan to stimulate the US economy would still be realized.
Today, the financial markets have a low activity of traders on the eve of the first round of the presidential elections in France, which will be held this Sunday. The risk that the results of the elections could violate the integrity of the EU, still hinders investors from actively operating in the financial markets. If Marin Le Pen wins, which promised to withdraw France from the European Union, then the euro and European stock markets could literally collapse. Following them, American stock markets can follow. The demand for gold and yen will grow sharply.
Of the news for today is worth highlighting data from the United States. At 13:45 (GMT), indexes of business activity in the manufacturing sector and service sector (PMI) from Markit for the US for April (preliminary value) are published. The index is an important indicator of the state of the US economy as a whole. At 13:30, the speech of the head of the Federal Reserve Bank of Minneapolis Neil Kashkari begins, which is likely to follow the statements of other representatives of the Fed on the monetary policy in the US in general, and will favor an early increase in the rate in the US and a reduction in the Fed's budget. This will have a positive effect on the dollar, but is unlikely to support the US stock indexes.
Support and resistance levels
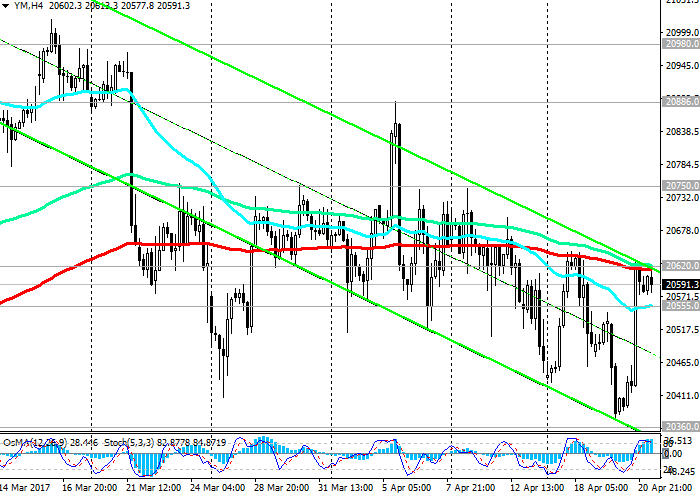
From the beginning of the previous month, the DJIA index, in general, is declining. With the absolute highs reached at the end of February near the 21170.0 mark, the DJIA index lost about 3.5%, having fallen to the current level of 20600.0. However, after yesterday's statements by US Treasury Secretary Stephen Mnuchin, the DJIA index rose, broke through the short-term resistance level of 20555.0 (EMA200 on the 1-hour chart), however, it was suspended by resistance level 20620.0 (the upper limit of the descending channel and EMA200 on the 4-hour chart).
The indicators OsMA and Stochastics on the 1-hour, 4-hour chart again unfolds to short positions.
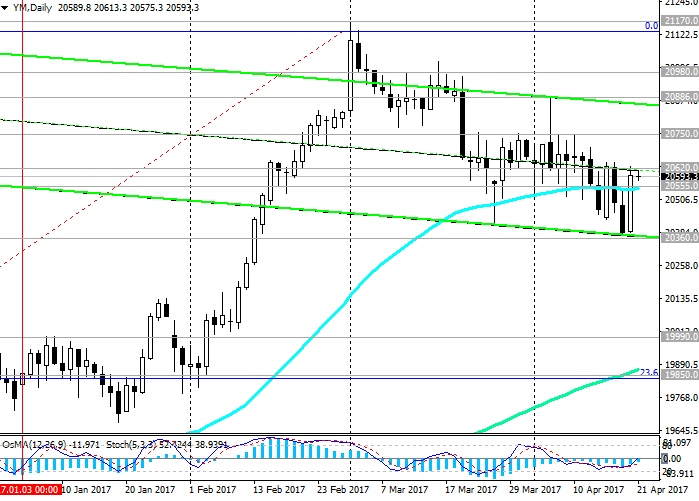
If the DJIA index returns below the level of 20555.0, then its decline may continue to the nearest support level of 20360.0 (the lower limit of the descending channels on the 4-hour and daily charts).
If the downward trend is to increase, the decline in the index may extend to the support levels of 1990.0 (December highs), 19850.0 (Fibonacci level of 23.6% correction to the wave growth from the level of 15660.0 after rebounding in February this year to the collapse of the markets since the beginning of the year. The maximum of this wave and the Fibonacci level of 0% is near the mark 21160.0). Further decline and breakdown 19600.0 level (EMA200 on the daily chart) will be critical for the bullish trend of the DJIA index.
To return to the purchases, the index must be fixed above the level 20750.0 (the upper limit of the range between the levels 20750.0 and 20360.0). While short-term downward correctional dynamics prevails.
Support levels: 20555.0, 20360.0, 19990.0, 19850.0, 19600.0
Resistance levels: 20620.0, 20750.0, 20886.0, 20980.0, 21170.0
Trading Scenarios
Buy Stop 20650.0. Stop-Loss 20540.0. Take-Profit 20750.0, 20886.0, 20980.0, 21170.0, 22000.0
Sell Stop 20540.0. Stop-Loss 20650.0. Take-Profit 20360.0, 19990.0, 19850.0, 19600.0